Follow this guide to gain access to more of the Custom Dimensions reports data in your Google Analytics dashboard. If you set up the Custom Dimensions tracking with the ExactMetrics addon you’ll be able to see the data at a glance in the ExactMetrics dashboard inside the WordPress admin. If you want to get more detailed reporting related to Custom Dimensions, read on.
Below are steps for users who have a Google Analytics 4 (GA4) property or a Universal Analytics (UA) property. If you’re not sure what kind of property you have, check out our guide to understand the differences between GA4 and UA.
View Custom Dimensions in GA4
To view custom dimensions in your GA4 property, you can create a custom exploration.
First, go to your GA4 property at analytics.google.com.

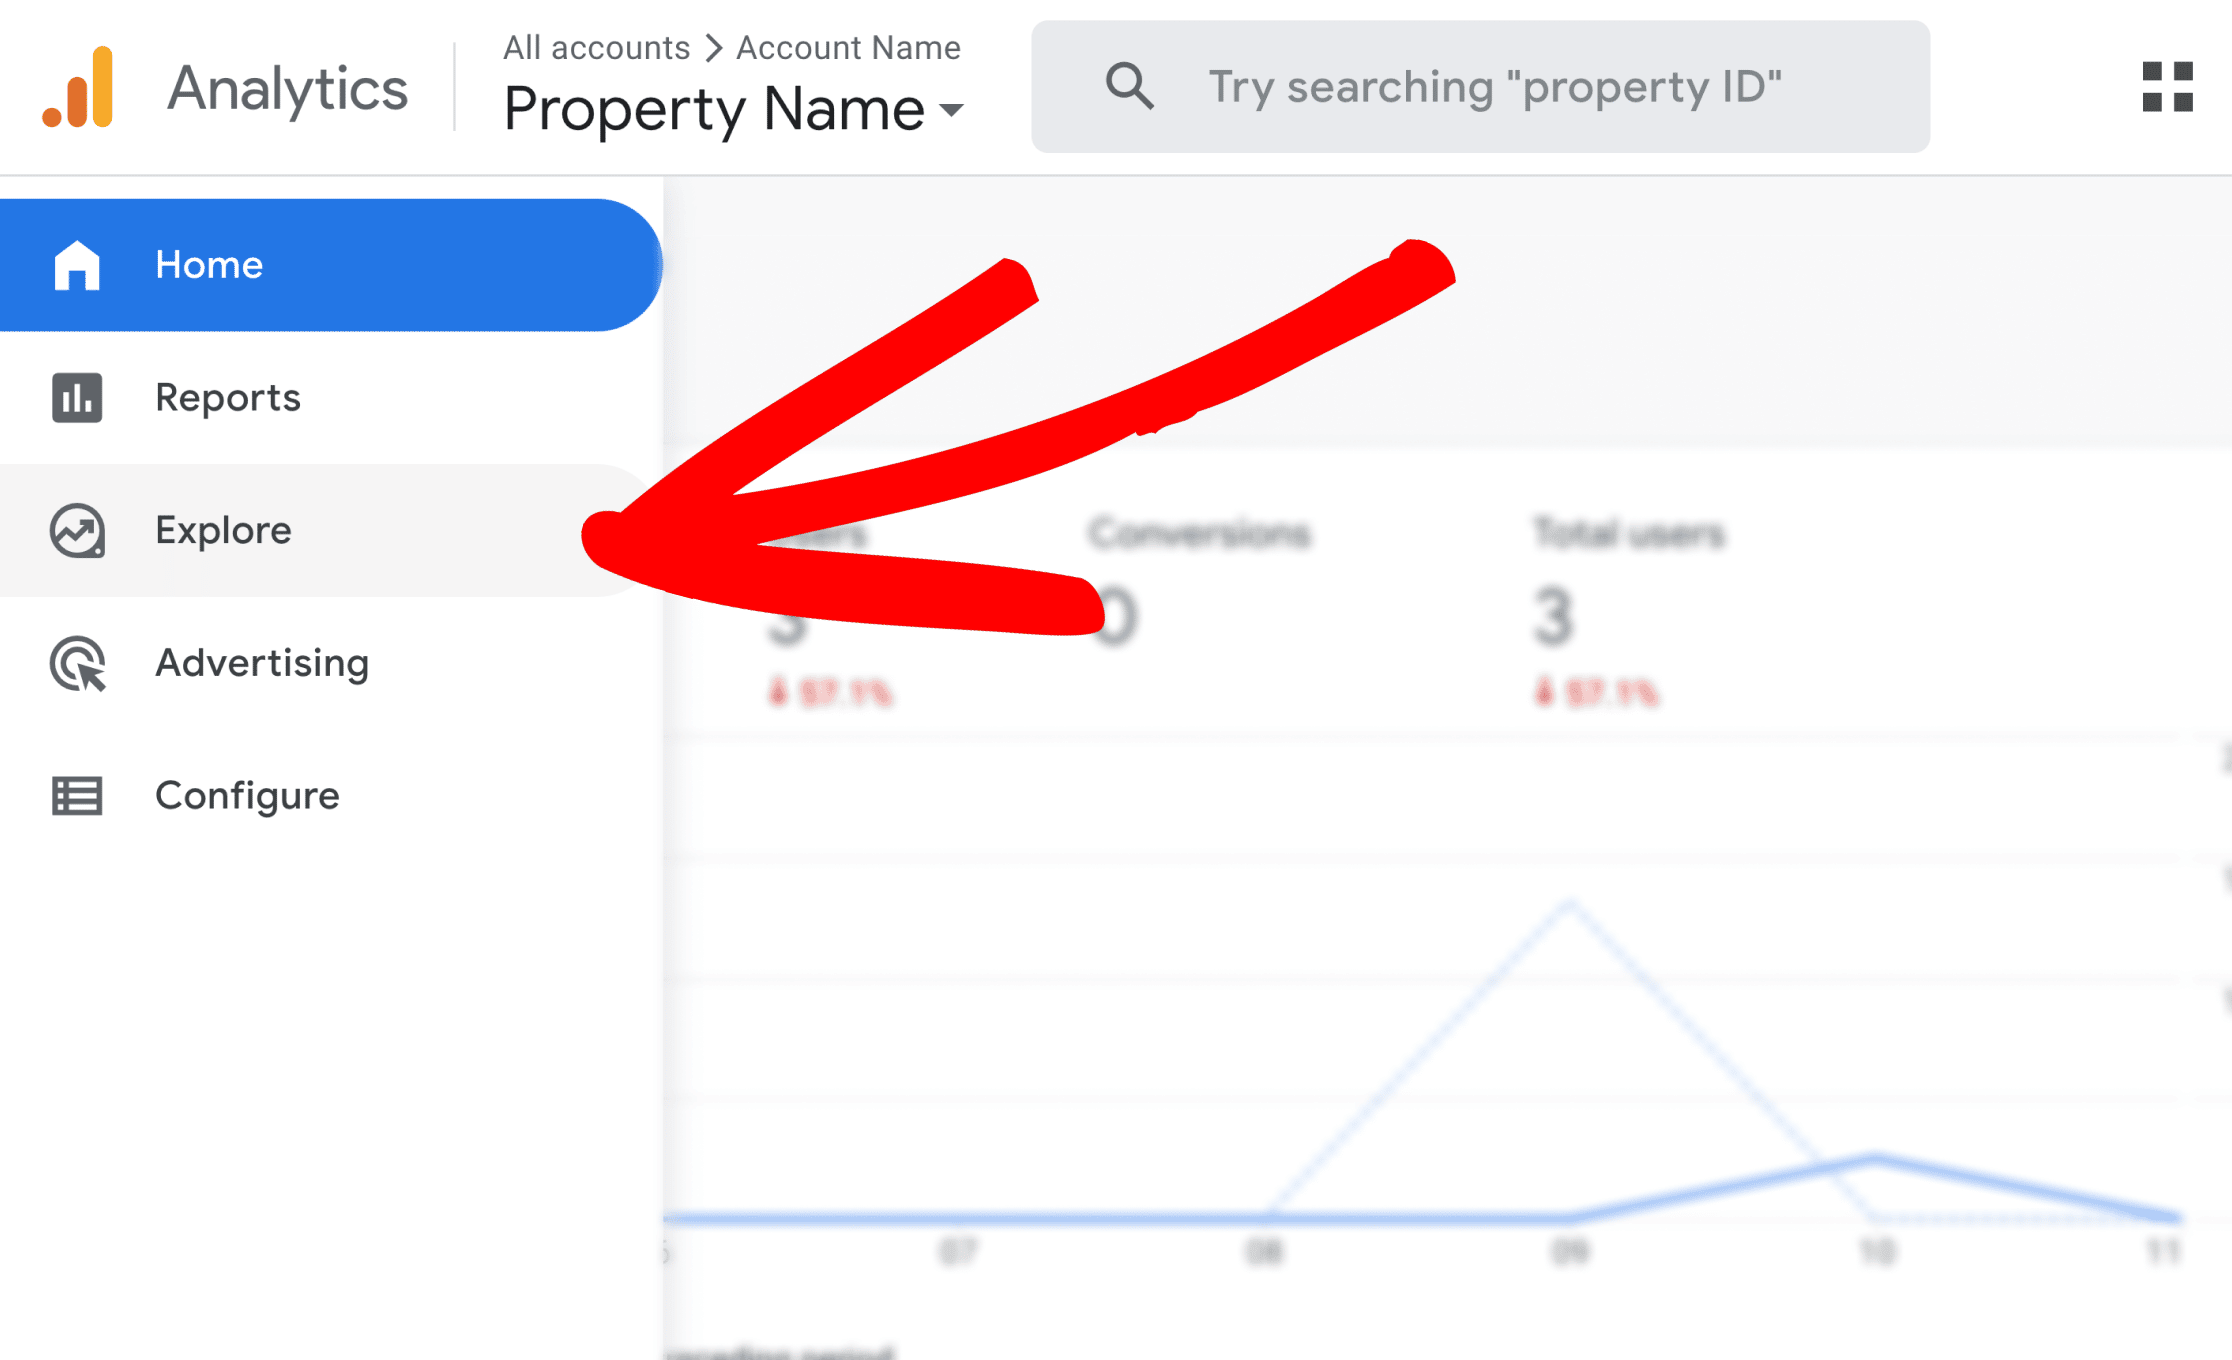
Then click on the Explore page.

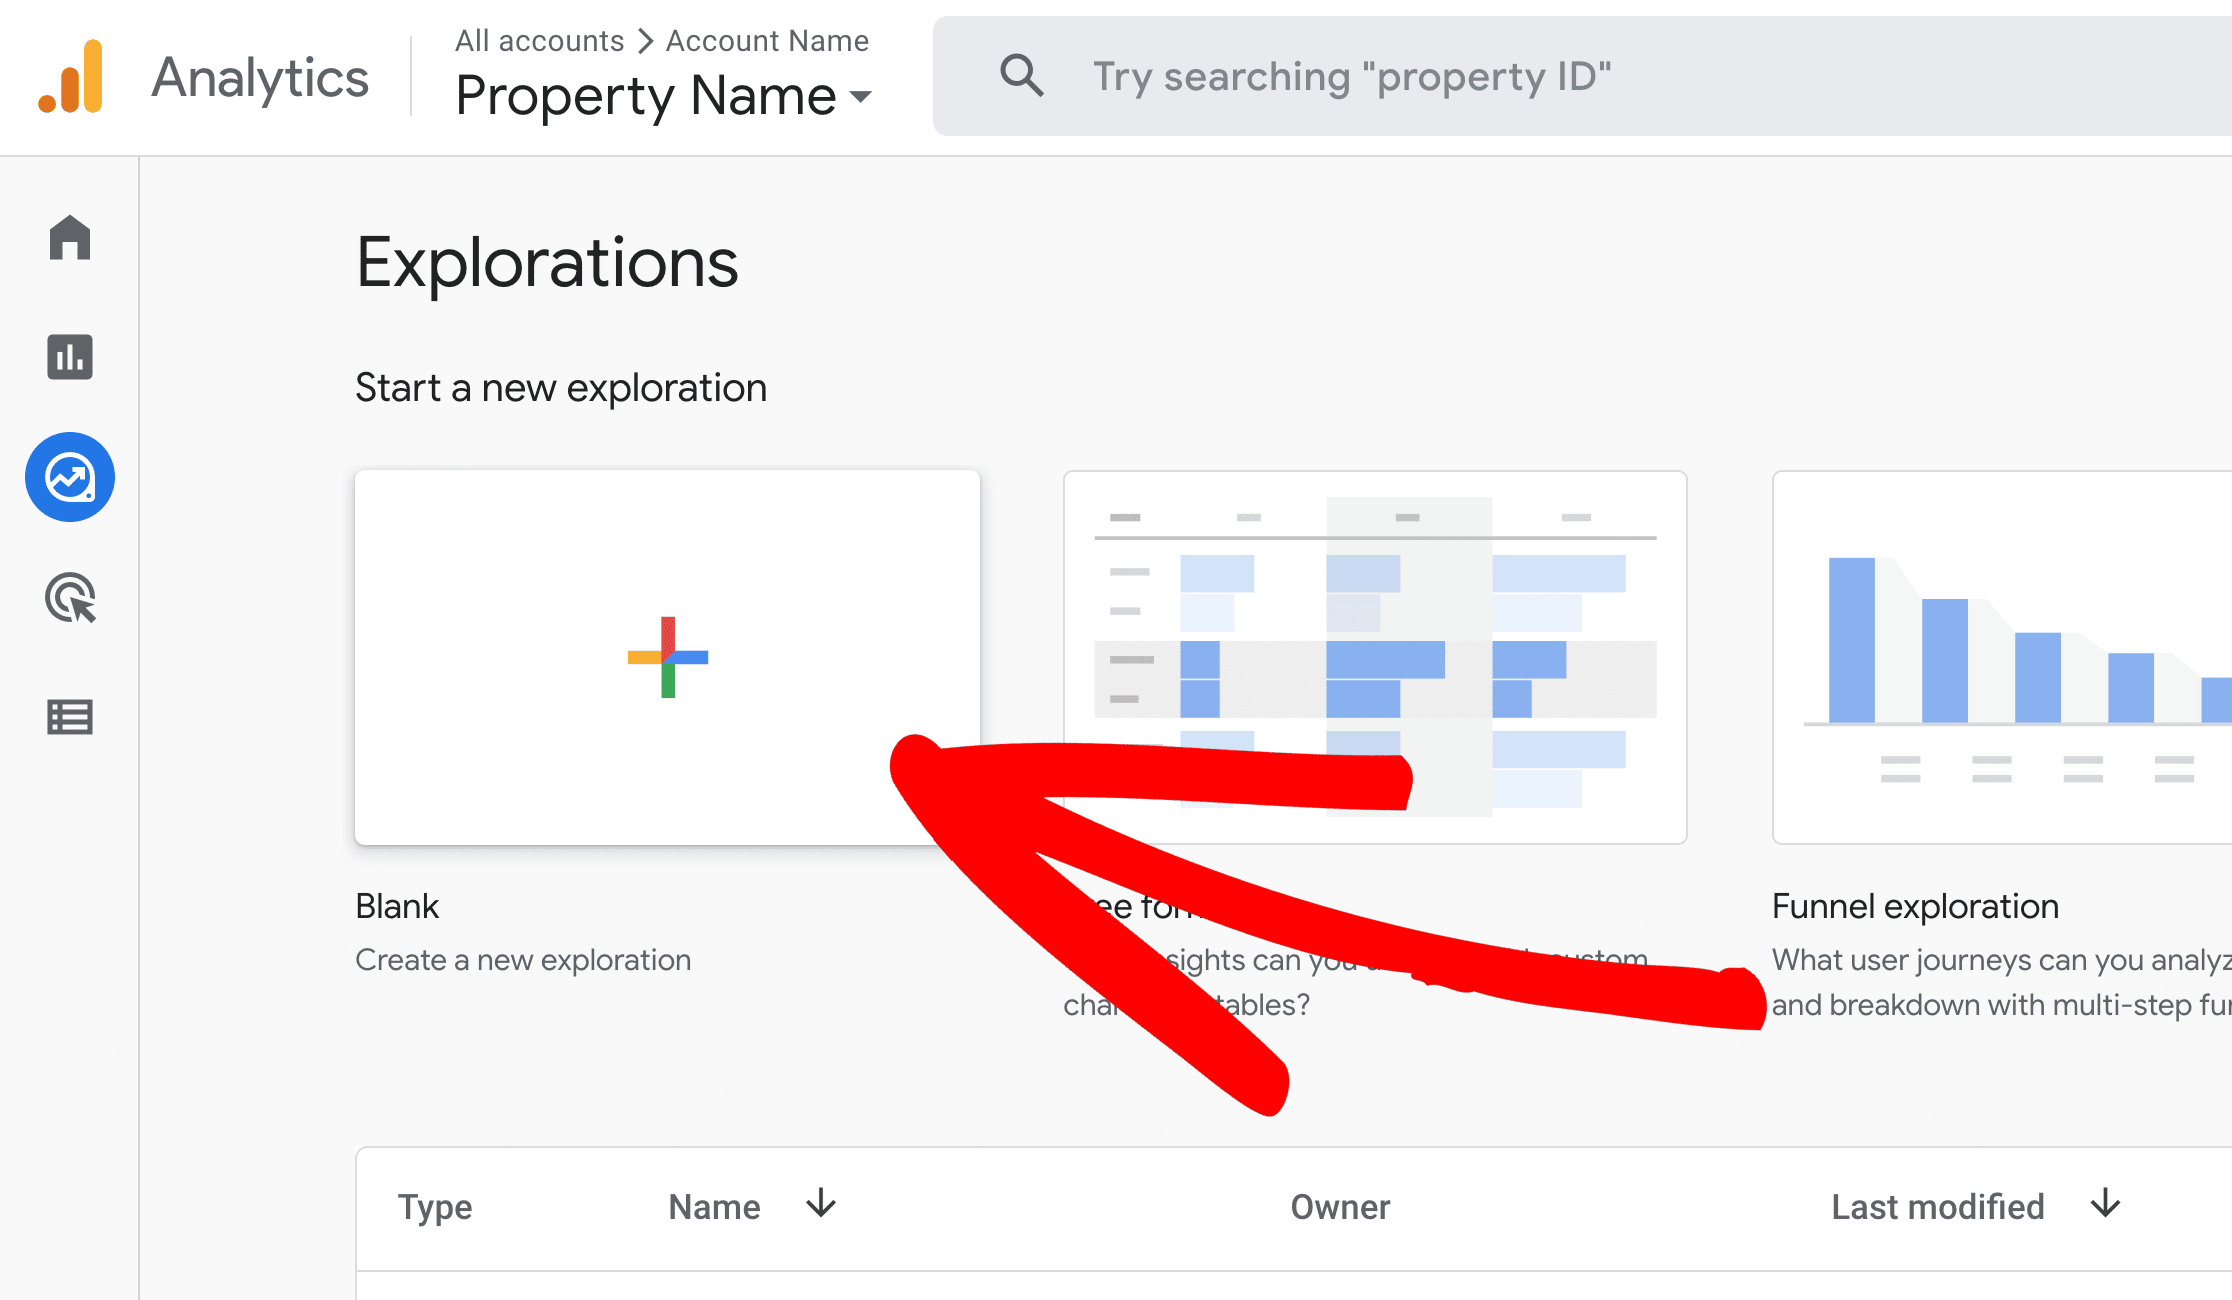
You’ll be asked to choose a template, such as a Blank template.

Once you’ve chosen a template, within the Variables column, click on the plus “+” to import dimensions and metrics.
Use the search bar to quickly locate a dimension. Select all of your dimensions and when finished, click on Import.
Once imported into the custom exploration, drag your dimensions into the Tab Settings column, under Rows.

Repeat the same step with metrics.
Use the search bar to quickly locate a metric. Select all of your metrics and when finished, click on Import.
Once imported into the custom exploration, drag your metrics into the Tab Settings column, under Values.

Once you have set the rows, columns (if needed), and values, the exploration will load in the data.
Feel free to try importing other dimensions and metrics to find the information you’re looking for.
Note: If you’ve recently set up custom dimensions, you will most likely see “not set” for the first 48 hours until enough data is collected and processed.
Creating a Custom Dimension Report (UA)
While at analytics.google.com, select your UA property.

Next, click the Customization button in the left panel and then click the Custom Reports button in the menu that expands. When that screen loads, click the “+ New Custom Report” button

In order to generate a new report, Google Analytics needs to know what to include in your report.
We are going to create a report to display page views by author, and we’ll name the report “Page Views by Author”.
In the Metric Groups section, click the + add metric button and type “pageviews” in the search input. Select Pageviews from the list by clicking on it.

The next step is to click the + add dimension button, write “author” in the search input, similar to the metric input, and select Author from under Custom Dimensions.

The final step is to click the Save button below the form.
That will redirect you to the custom report you just created.

The best part about this is that you can access the report any time now at Customization » Custom Reports » Page Views by Author.


