GA4 reporting can definitely be overwhelming, especially with so many different types of Google Analytics reports to track.
So, you’re probably wondering which Google Analytics reports will be most helpful for your unique business. While every business is different, there are a few reports that are important for pretty much everyone who runs a website.
In this article, we’ll take a look at the best Google Analytics reports to start tracking immediately. Before we dive in…
What Are Google Analytics Reports?
In straightforward terms, Google Analytics Reports provide a consolidated view of website performance, offering valuable insights to help you make data-driven decisions to grow your business and improve your digital marketing strategy.
Google Analytics Reports are crucial for businesses and website owners seeking to understand how users interact with their website, how their content is performing, and lots more. There are a number of standard Google Analytics 4 reports, but users can also create custom exploration reports in GA4 to dig deeper and find more niche data.
How to Get Reports from Google Analytics?
To get Google Analytics reports, you just need to have Google Analytics tracking set up on your website. Then, you’ll be able to use your Google Analytics login to access reports in your GA4 account. You can set up tons of advanced tracking and custom configuration to track all kinds of helpful data.
That said, setting up Google Analytics tracking isn’t the easiest task, especially for beginners. It involves editing code, and to access advanced tracking, it gets even more complicated. So, if you haven’t set up GA4 tracking yet, we recommend using a tool like ExactMetrics to simplify the process.
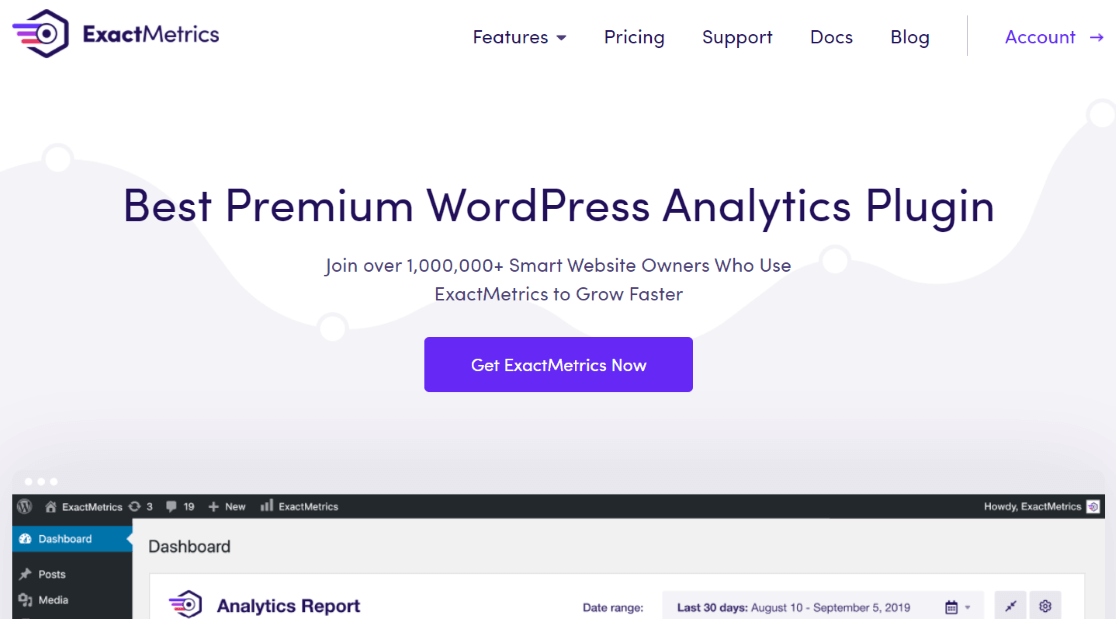
ExactMetrics is the best premium WordPress Analytics plugin, allowing you to easily set up Google Analytics without editing any code or needing a complicated tool like Google Tag Manager. You get advanced tracking right out of the box with an extremely user-friendly interface and Google Analytics reports right inside your WordPress dashboard.
To get Google Analytics set up for your website, head to our step-by-step tutorial on How to Add Google Analytics to WordPress.
Now, ready to learn about the different types of Google Analytics reports and the best ones to track?
Best Google Analytics Reports
- Conversion Events
- Overall Traffic and Traffic Sources
- Pages and Screen Report
- Landing Pages Report
- Device and Browser Type
- Demographic and Interests Reports
- Search Console Queries
- Site Speed Report
1. Conversions Report
Although getting people to visit your website is a big part of running a website, it’s really only half the picture. The actions users take once they’re on your site are the real metrics for gauging success. These are called conversion events, and they’ll need to be configured to what your business’s goals are.
For example, is your goal to get potential clients to contact you? To sign up for your newsletter? To buy a product? To click on an ad?
No matter what your goals are, you definitely want to track how many users are completing them.
Since conversions are custom events, they won’t already be set up in your Google Analytics reports. The good news is that if you use ExactMetrics, the plugin can automatically set up event tracking in GA4 for:
- eCommerce purchases, add-to-cart events, and more.
- Form submissions
- Click-to-call links
- File downloads
- Video plays and watch time
- Affiliate link clicks
- Scroll depth events
- And lots more!
Check out our Ultimate Guide to WordPress Conversion Tracking (GA4) for instructions on how to create conversion events.
Conversion Events in Google Analytics
Once you set up your events, you can mark them as conversions in Google Analytics. Just click the Admin cog, then click Events in the second column, find the event you want to mark as a conversion, and use the toggle to Mark as conversion.

With ExactMetrics, you’ll be able to see the number of conversions and the conversion rate in tons of your reports, right inside WordPress. For example, which landing pages are leading visitors to perform a conversion action, or which traffic channel has the highest conversion rate?
After marking events as a conversion, you can also see your conversion events in your Google Analytics reports under Reports » Engagement » Events.

Now that you know the basics of setting up your website’s goals through conversions event let’s see some more detailed reports in Google Analytics.
2. Overall Traffic and Traffic Sources
You’re probably familiar with total traffic since it’s one of the most common metrics to track. But, do you know where your traffic is coming from? Are users clicking a link on social media, finding your site in Google search, or using another channel?
Google Analytics reports can tell you that information!
Overall Site Traffic
To see your overall traffic report in ExactMetrics, just click ExactMetrics » Reports. Here’s where you can find all your main website stats in your WordPress dashboard. These are standard numbers to track for any website, giving you a broad look at your overall site health and traffic.
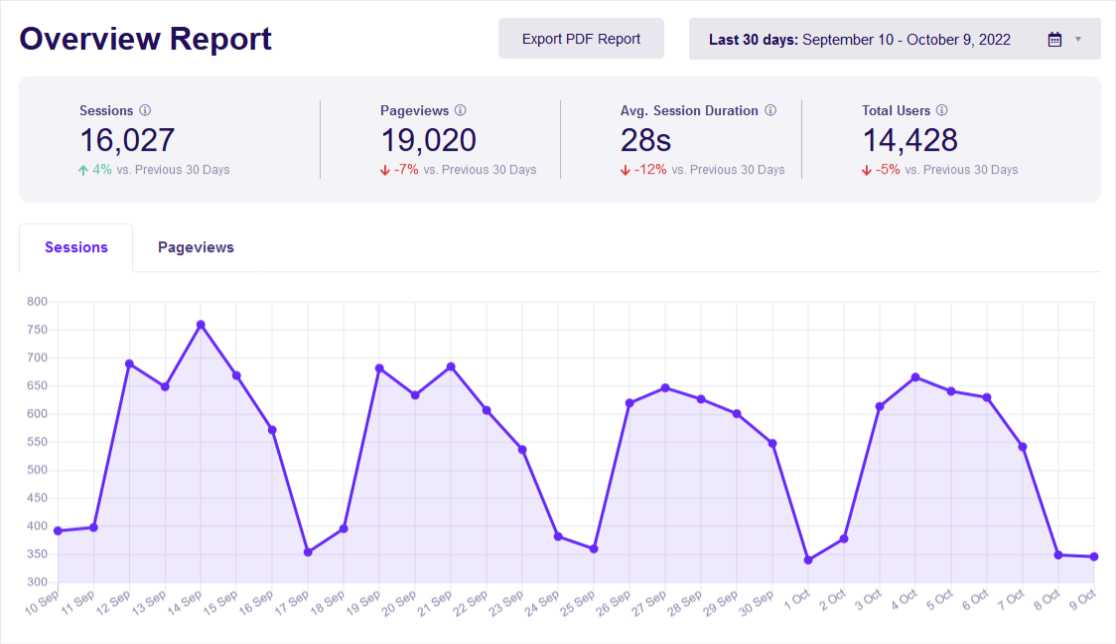
You’ll want to keep a close eye on these metrics and work to improve them. They’re also great to use on a monthly report or in a spreadsheet for a general look at how your website is performing. Check out this post to find out How to Share your Google Analytics Reports.
You can scroll down in the report to see additional overviews like new vs. returning visitors, your top referral sources, your top posts/pages, and more.
Google Analytics Traffic Source Report
Now, don’t you want to know where this traffic is coming from? From ExactMetrics, you can click Traffic » Overview from the top menu to access your Traffic Details report.
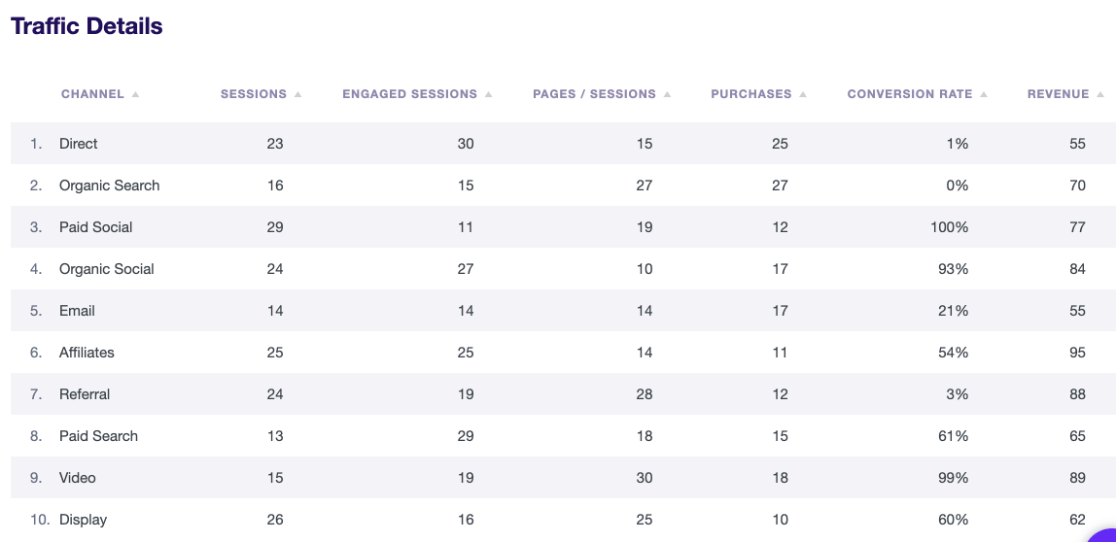
Without even leaving WordPress, you can see which traffic channel has the most engaged sessions, the highest conversion rate, and more.
To find this Google Analytics report in GA4, go to Reports » Acquisition » Traffic Acquisition. Here, you can see how many people visited your website along with other key metrics broken down by channel.

Scroll down to see your overview totals in the table along with important metrics for each channel. You can hover over any of the column headers to see a helpful tip about what each metric means.
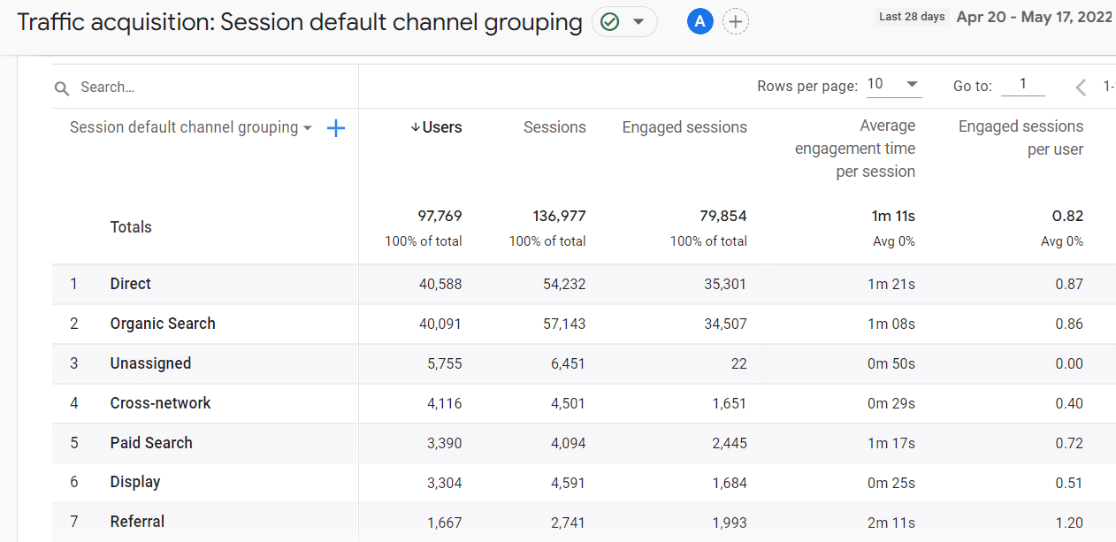
Use this report to see which channels are working the best for you and which ones need work. See at-a-glance how long your social media visitors are spending on your site, how engaged visitors are when they come from organic search, and more.
3. Pages and Screen Report
Your overview report in ExactMetrics will show your most popular posts and pages by views, but you’ll want to dig deeper to see if your pages are actually engaging visitors.
In ExactMetrics, head to Publishers » Pages Report. Here you can see page views, engaged sessions, new sessions, and the bounce rate for your top pages.

If a page is getting a lot of views but it has a high bounce rate, you should investigate why that page is attracting visitors but not keeping them on your site.
To see pages in your Google Analytics reports, go to Reports » Engagement » Pages and Screens. You can scroll down to the table to find the conversion rates for each page and other important metrics.
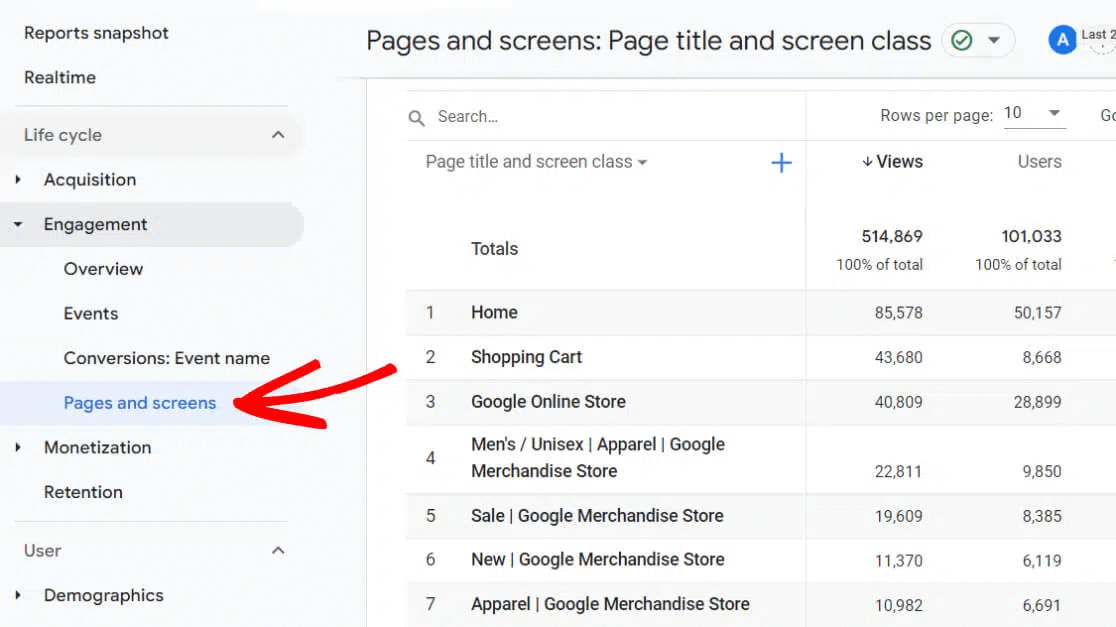
Use the drop-down menu at the top of the pages column if you want to change how your pages are shown in the table, such as by page title instead of page path (URL).
4. Landing Pages Report
Which pages are your website visitors arriving on? It’s definitely not always your home page! Seeing which pages your visitors are arriving on (or “landing” on) can be very helpful when you’re looking into how your pages are performing.
For example, let’s say that users who land on your blog pages are spending over a minute there, reading your posts and interacting. Those who land on your homepage, however, are bouncing at a pretty high rate and not spending long on your site.
That would definitely mean that you need to evaluate your home page. Is it too slow? Is it confusing to navigate? Is there a clear call to action? Is it working on mobile?
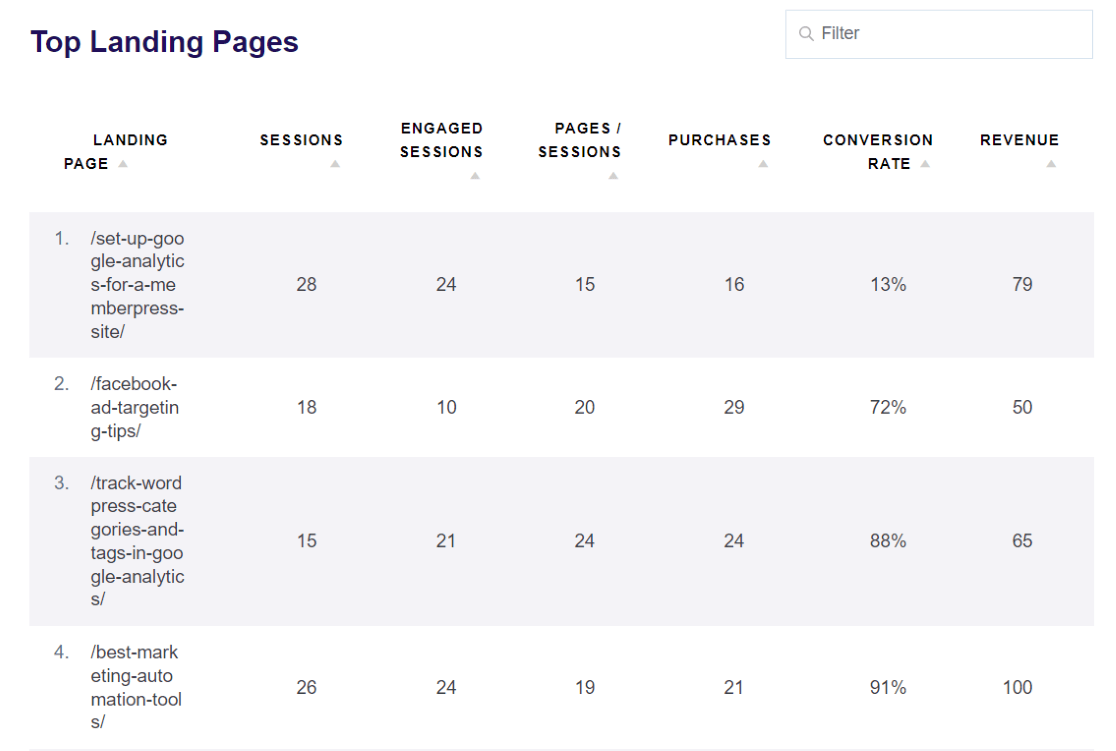
To see how your landing pages are performing using ExactMetrics, you can simply click Reports » Publisher » Overview. Quickly see how many visits each landing page has, the average session duration, and the bounce rate right from WordPress.

Want to see even more landing page metrics in WordPress? Click Reports » Traffic » Landing Page Details to see crucial metrics like conversion rate, engaged sessions, revenue, and more.
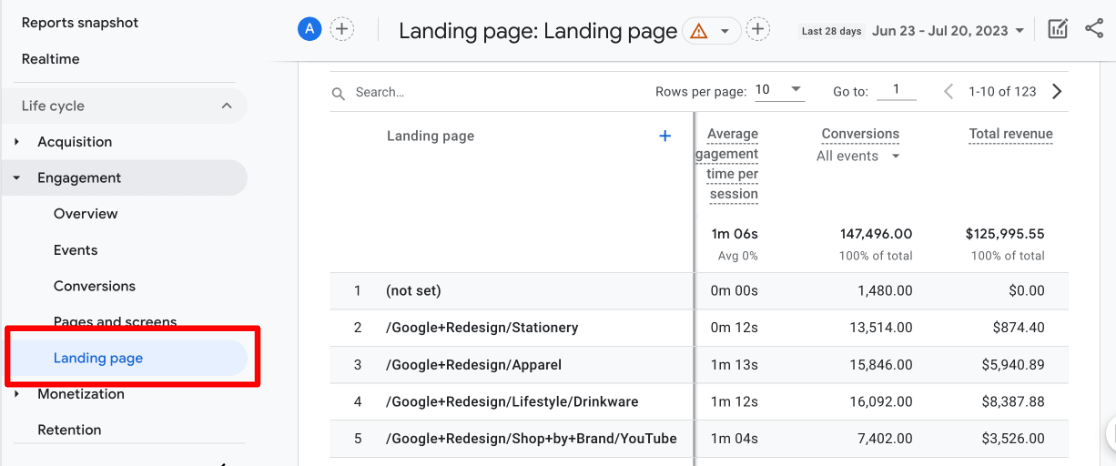
GA4 reporting includes a landing page report, but you won’t be able to see it in your default Google Analytics reports. To access it, you’ll first need to follow our instructions for adding the report to your navigation.
Once you’ve successfully added it, you’ll then see Landing Pages under Reports » Engagement.
5. Device and Browser Type
Are most of your visitors using mobile devices to visit your site? Or are more of them coming via desktop? Do you know which browsers they use to access your site?
These are important metrics to consider! Not only can it give you insight into how your visitors are browsing when they find you, but it can also help you see if your mobile site is performing as well as your desktop site and spot any issues with a certain device or browser.
To see an overview of your visitors’ devices and browsers in WordPress, just head to ExactMetrics » Reports » Traffic » Technology.

To find more metrics about devices and browsers in your GA4 reports, go to Reports » Tech » Tech Overview. Then, find the cards titled Users by Browser and by Device category.
Click the links at the bottom to view the full Google Analytics reports.
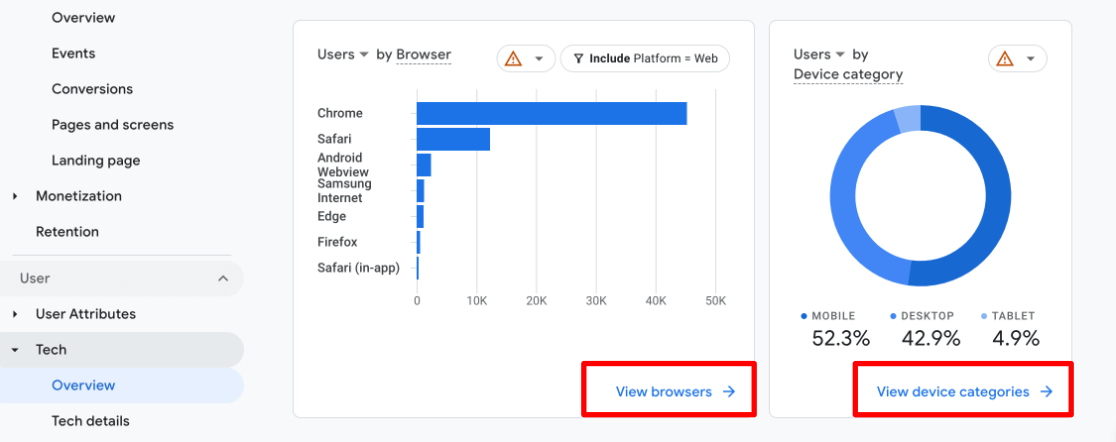
In the table for each report, you can see lots of metrics like the number of new users, engagement rate, and more.

In general, people spend less time on a mobile website vs. a desktop. However, if there are big differences between your engagement metrics for mobile vs. desktop, you’ll want to do some testing to investigate further.
Low engagement metrics on a certain device or browser can indicate that those users aren’t finding what they’re looking for, having a hard time navigating your site, or are leaving quickly because it’s not loading fast enough.
6. Demographic and Interests Reports
Wondering where in Google Analytics you can find insights into where users are coming from?
Whether you’re trying to attract local, regional, national, or international traffic, it’s important to know where your visitors are located and what they’re interested in. Luckily, the demographics and interest report in Google Analytics can help.
If you’re using ExactMetrics, you can easily see the Top 10 Countries where visitors are located in your Overview report.

You can also get a breakdown of the Age and Gender of your website users along with their Interests by going to Publishers » Overview.
Note: Google Analytics automatically provides demographic reports for geographical locations and languages. But, if you want to see data for interests, gender, and age, you’ll need to enable a feature called Google Signals. Head to this tutorial to learn How to Enable Google Analytics Demographics & Interest Reports.

To see your Demographics and Interests in your Google Analytics reports, you can simply click the View Full Interests Report or View Countries Report link if you’re viewing either report in ExactMetrics.
Alternatively, head to Reports » User » Demographics » Demographic details. You can use the drop-down menu to change the table to City, Region, Language, and more (if enabled).

For instance, if you’re a local business, seeing your visitors by the city can be super helpful for finding out which suburbs you’re getting traffic from.
If you’re targeting a broader audience, seeing which states you’re attracting the most traffic from can help you figure out where to target paid ads. Or, it can help you determine what kinds of region-specific content to create.
7. Search Console Queries
This is one of the best Google Analytics reports that every website owner is interested in. You can see the keywords people are using to find you in search results.
Not only that, but you can see how many impressions you’re getting (how many times you’re appearing in results), the click-through rate, and your ranking position in SERP (search engine results page) for each keyword/query.
Note: The Queries report isn’t available in Google Analytics by default. To get this report to show up, please follow our tutorial on How to Connect Google Search Console and Google Analytics.
Once you’ve connected the two tools, to see this Google Analytics report using ExactMetrics, just click the Search Console tab from your reports in WordPress.

You can see your top 50 Google search terms along with clicks, impressions, CTR, and average position.
Bonus Tip: If you’re using an SEO plugin like AIOSEO, you can use ExactMetrics to track your focus keywords.
To see your Search Console report and queries in Google Analytics, you’ll first need to follow the instructions for adding the report to your library. Then, you’ll be able to find the report by clicking Reports » Search Console » Search Console » Queries from your Google Analytics account.
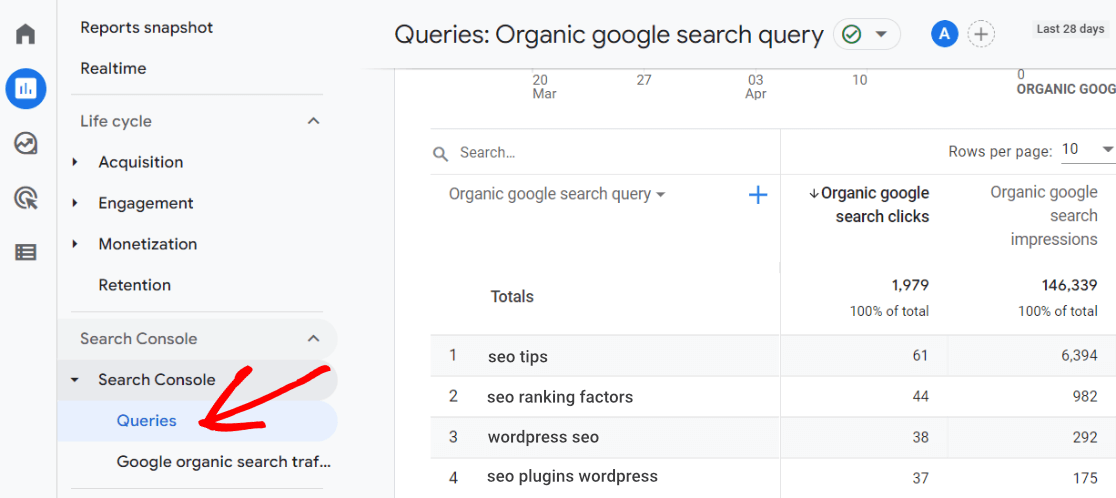
This report is super helpful when you’re working on building up your organic traffic and optimizing SEO. You can quickly see which keywords are gaining you traffic and which ones need more work.
8. Site Speed Report
How quickly your website loads initially and continues to load during browsing is a huge deal for your visitors and Google.
Page speed has been a ranking factor for years, and now we have to think about Core Web Vitals as well. If your website isn’t fast enough, not only will your visitors not wait around for it to load, but it can hurt SEO and could lower rankings in the search results.
To see your site speed in WordPress with ExactMetrics, just head to Reports » Site Speed. You can quickly see how well your site is performing along with suggestions for how to improve.

Unfortunately, you can’t see site speed in your Google Analytics reports. However, you can use Google’s PageSpeed Insights tool to check your website speed and performance.
In general, you want your average website load time to be under 2 seconds, so it’s important to keep an eye on your site speed report. Check out our best tips to speed up your WordPress site.
Well, that’s it for our list of the different types of GA4 reports to start tracking today. Plus, now you know how to use ExactMetrics to get your Google Analytics reports super easily in WordPress!
If you enjoyed this article, we think you’ll want to check out How to Create Google Analytics 4 Custom Exploration Reports.
Not using ExactMetrics yet? What are you waiting for?
Don’t forget to follow us on Twitter and Facebook to see all the latest Google Analytics tutorials.


