Are you curious about key eCommerce metrics and KPIs for your online store and wondering how to track them in Google Analytics?
Monitoring important eCommerce metrics and KPIs can reveal areas where your site needs improvement and help you make changes to increase revenue.
In this guide, we’ll look at key metrics for eCommerce and KPIs to track in Google Analytics 4 (GA4), which can help you boost your earnings.
How to Track eCommerce Metrics in WordPress
Before we dive into our list of metrics, we want to offer WordPress users a quick and easy way to enable eCommerce tracking in GA4 on their WordPress sites.
Using the ExactMetrics eCommerce addon, you can easily set up eCommerce tracking on your WordPress site without touching any code.
ExactMetrics is the best Google Analytics plugin for WordPress. It allows you to connect your WordPress site with Google Analytics in just a few clicks, so you can view all the important data right in your WordPress dashboard.
With a simple click, you can enable advanced tracking features like event tracking, revenue tracking, form tracking, custom dimension tracking, outbound link tracking, real-time reports, and much more.
For eCommerce tracking, ExactMetrics integrates directly with:
- WooCommerce
- GiveWP
- Easy Digital Downloads
- MemberPress
- Charitable
- LifterLMS
- Restrict Content Pro
- WishlistMember
- MemberMouse
Get started with ExactMetrics today!
Now, let’s explore the key metrics for eCommerce that you should track for your online store.
10 Top eCommerce Metrics to Track Now
What are the best eCommerce metrics and KPIs to track to measure the performance of your online store?
Let’s explore the key metrics you should be tracking in GA4:
- eCommerce Revenue
- Average Order Value (AOV)
- Website Speed
- Shopping Cart Abandonment
- Advertising Cost vs. Revenue
- Newsletter Form Conversions
- Customer Lifetime Value (CLV)
- Customer Retention Rate
- Top Conversion Sources
- Customer Acquisition Cost (CAC)
1. eCommerce Revenue
Your eCommerce revenue is probably the most important metric for your store. How much did you make during the report’s time period?
To find this in GA4, go to Reports » Life Cycle » Monetization » Overview.

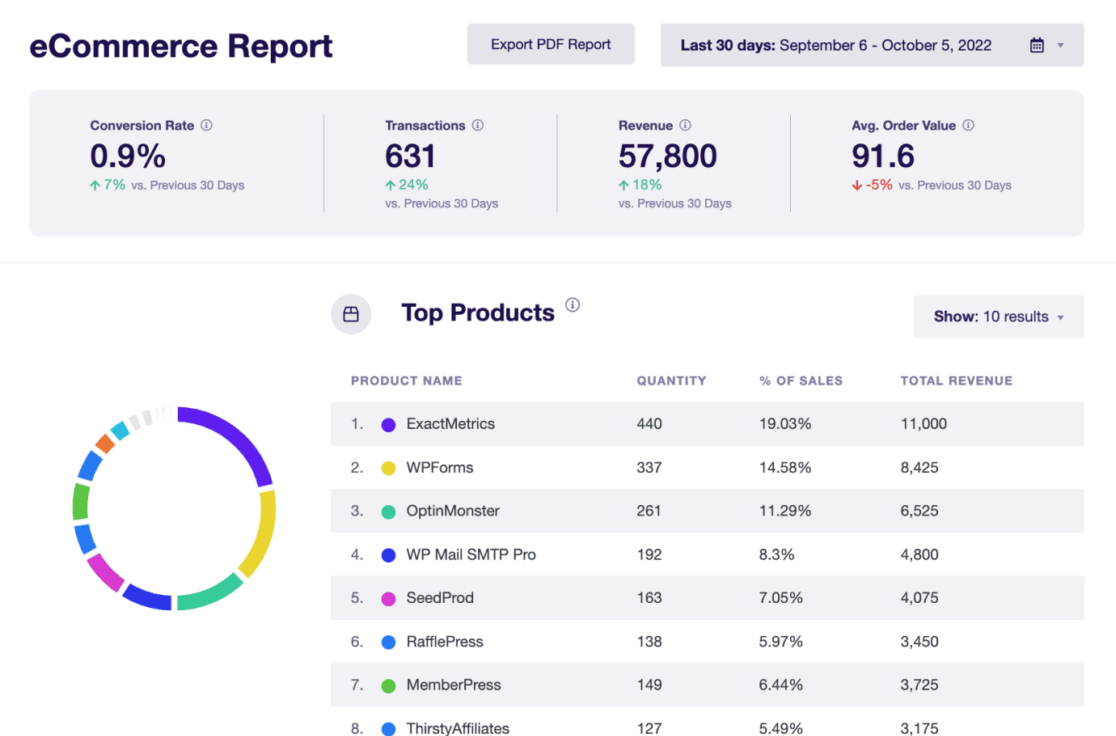
If you’re using ExactMetrics, simply go to the eCommerce tab to see your revenue at the top of the report.

Your total revenue shows the overall health of your store. Monitor it weekly or monthly to watch the trend.
2. Average Order Value (AOV)
Increasing your store’s revenue often involves getting customers to spend more per purchase. To do this, track and improve your Average Order Value (AOV).
This metric can also be found at the top of your ExactMetrics report.

A higher AOV means more income per order. The basic calculation is the total revenue divided by the total number of orders.
In GA4, this metric is called average purchase revenue. To find it, go to Reports » Monetization » Overview and look for the Average purchase revenue per user graph.

For more detailed data, create a custom Exploration report. Here’s how:
Open the Explore tab and create a Blank report.

Name your report (e.g., Average Purchase Revenue). Click the plus icon in the Dimensions box.
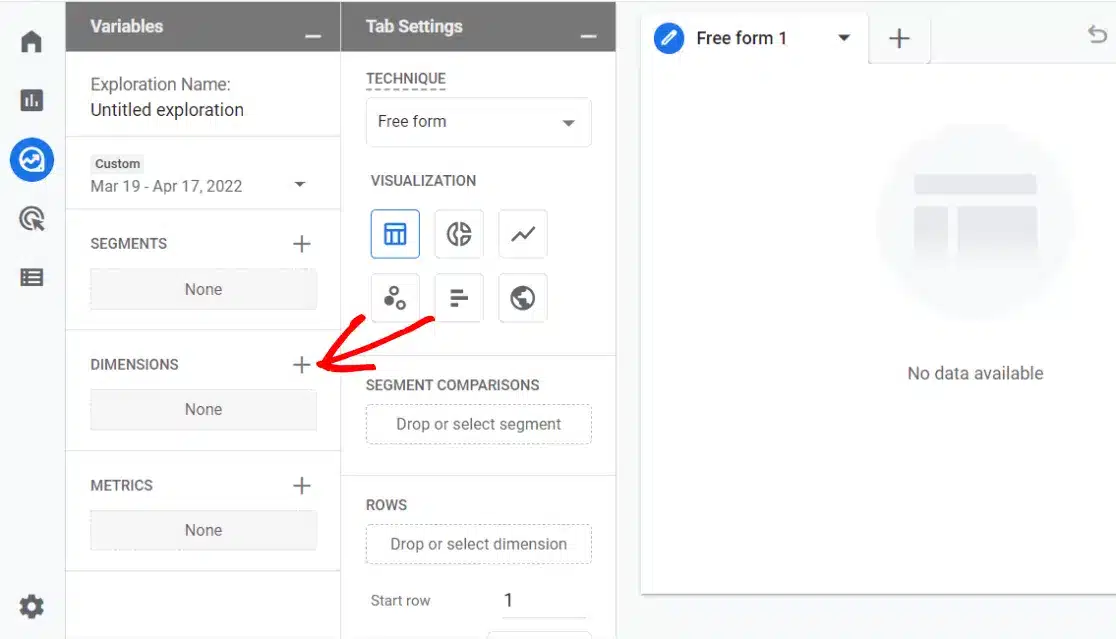
Import Device category, Session source/medium, City, and Session campaign.
Import Average purchase revenue into the Metrics box.
Your boxes should now look like this:

Drag Session source/medium to the Rows box. Drag Average purchase revenue to the Values box.
Now you have a report of your average purchase revenue by source/medium. You can also see this data by city, device category, or campaign.
How to Raise Your AOV
Boosting your store’s AOV can be done in several ways. Here are 3 main methods:
1. Upsell
Encourage customers to buy more items or more expensive products.
For example, Best Buy adds protection plans and setup services during the product selection and checkout process.

2. Add a Minimum for Free Shipping
Offer free shipping for orders over a certain amount, as Old Navy does:

3. Suggest Popular Products
Show popular products to encourage additional purchases. You can easily display popular products on your (WordPress) site with ExactMetrics Popular Posts.
Configure it under ExactMetrics » Popular Posts » Popular Products.

3. Website Speed
According to an Unbounce study, nearly 70% of consumers say a website’s speed influences their buying decision and whether they’ll return.
What good are other metrics if your slow website is causing potential buyers to leave?
Google’s page experience update also favors faster web pages in search results.
Ensure your website is running quickly. With ExactMetrics, you can access your speed report directly from your WordPress dashboard, see crucial site speed metrics, and tips on improving them.

4. Shopping Cart Abandonment
On average, about 76% of people abandon their carts before completing their purchase. That’s a significant number! How does your store compare?
You need to set up a custom Explore report to view your shopping cart abandonment rate in GA4.
Start with a Blank report and name it something like “Shopping Funnel.”

Select the Funnel exploration option in the Technique box.

Click the pencil icon next to Steps and create 3 steps:

- Step 1: Name it “Add to Cart” and choose add_to_cart as the condition.
- Step 2: Name it “Begin Checkout” and choose begin_checkout as the condition.
- Step 3: Name it “Purchase” and choose purchase as the condition.
Here’s what your steps should look like:

Finally, click the blue Apply button in the upper right to see the shopping funnel report you just created. You’ll find the Abandonment rate right in your report.

For ExactMetrics users, tracking cart abandonment is as easy as clicking a button. Simply head to eCommerce – Cart Abandonment:

To see crucial cart abandonment metrics for products:
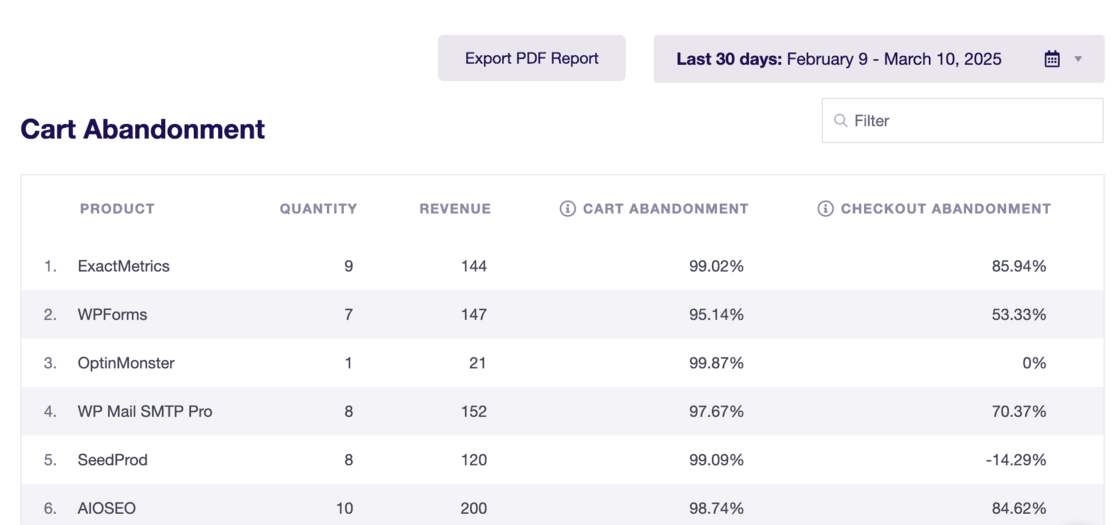
Or even see what happens on a day-to-day basis:
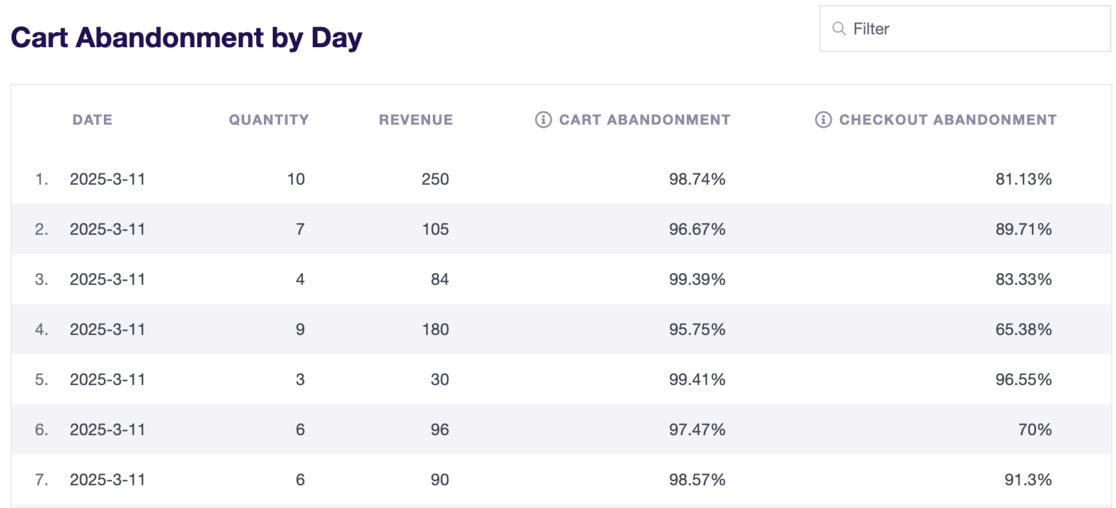
Analyzing your eCommerce purchase funnel is also super easy. Just head to ExactMetrics » eCommerce » Funnel:
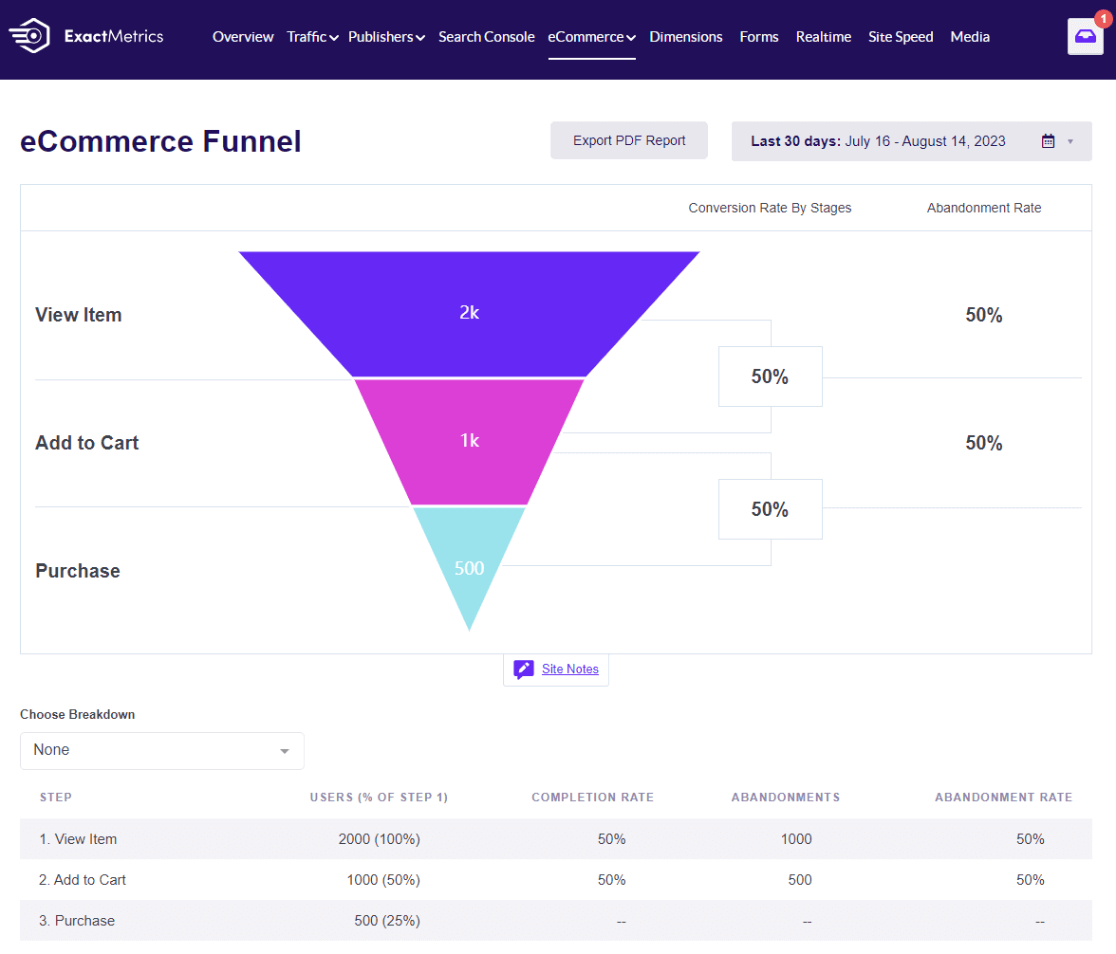
Common reasons customers abandon their carts are:
- Unexpected costs at checkout, such as high shipping rates
- Slow shipping
- Lack of security badges or trust seals
- Long forms or forced account creation
Want more tips on improving your cart abandonment rate? Read our best tactics to reduce shopping cart abandonment.
5. Advertising Cost vs. Revenue
Are you running Google Ads? Are they bringing in more revenue than what you’re spending?
You can create a custom report in GA4 to see these important numbers.
Start with a Blank report.

In the Dimensions box, add Google Ads campaign.
In the Metrics box, add Purchases, Google Ads cost per click, Google Ads cost, and eCommerce revenue.

Then, drag your Dimensions to the Rows box and your Metrics to the Values box.
Now, you have a report that shows how much each ad campaign costs and the revenue it generates.

Simple ideas to improve your return on ad spend:
- Disable or improve low-performing ad campaigns
- Run more ads for higher-cost products
- Refine keyword targeting and use geo-targeting where relevant
- Optimize your landing pages and overall site user-friendliness
6. Newsletter Form Conversions
Your email list is one of your biggest assets. Growing an email list helps you connect with leads and customers, drive repeat sales, improve your onboarding experience, and engage customers with your brand.
Tracking how many people submit your forms and join your email list is important. This data helps you make decisions that can increase your revenue.
Using the ExactMetrics Forms addon is the easiest way to track form submissions in Google Analytics. With the Forms addon, there’s no need to set up extra in Google Analytics or Google Tag Manager.
When you activate the addon, it automatically tracks form submissions as a Google Analytics event. Open your report to see impressions, conversions, and conversion rates for each form:

If you want to track form submissions without using ExactMetrics, you may need to refer to this detailed form tracking tutorial.
7. Customer Lifetime Value (CLV)
Customer Lifetime Value (CLV) is the total amount an average customer might spend at your store during their lifetime.
Knowing your customers’ lifetime value helps you decide how much to spend on marketing to them.
Find the lifetime value report in GA4 using the built-in user lifetime explore report. Go to the Explore tab and scroll to the right to find “User lifetime.” Click on it to access a pre-set report.

The report is initially broken down by the first user medium.

Try using other Dimensions by dragging them to the Rows box.
Knowing your average customer lifetime value, you can decide how much to spend on attracting new customers and keeping them returning to make your business profitable.
8. Customer Retention Rate
It’s cheaper to keep a customer than to acquire a new one, but many customers won’t return for another purchase.
Most customers are focused on fulfilling a need and are not interested in a long-term relationship with your brand. However, with a retention strategy, you have a better chance of turning first-time buyers into repeat customers.
To access this data in GA4, return to the funnel report you created in the Shopping Cart Abandonment section. Add a Dimension: New/established, and drag it into the Breakdown box.

Look at your report.

For example, you might see that new users abandon their carts 83.91% of the time, while “established” (returning) users abandon their carts 66.41% of the time.
9. Top Conversion Sources
Which referral sources are bringing in revenue (conversions)? Is social media sending buyers to your site? Discover how much revenue you’re making from each source in your ExactMetrics eCommerce report.

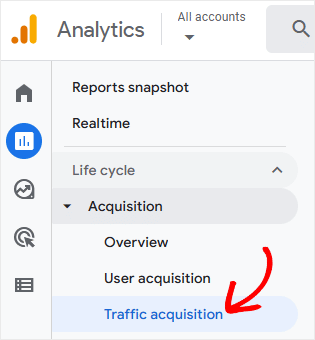
To view Google Analytics eCommerce sales (purchases) and revenue by channel, navigate to Acquisition » Traffic acquisition.
Then, scroll to the right in the table to find Key events and Total revenue.
Click the All Events drop-down arrow under Conversions and select Purchase.
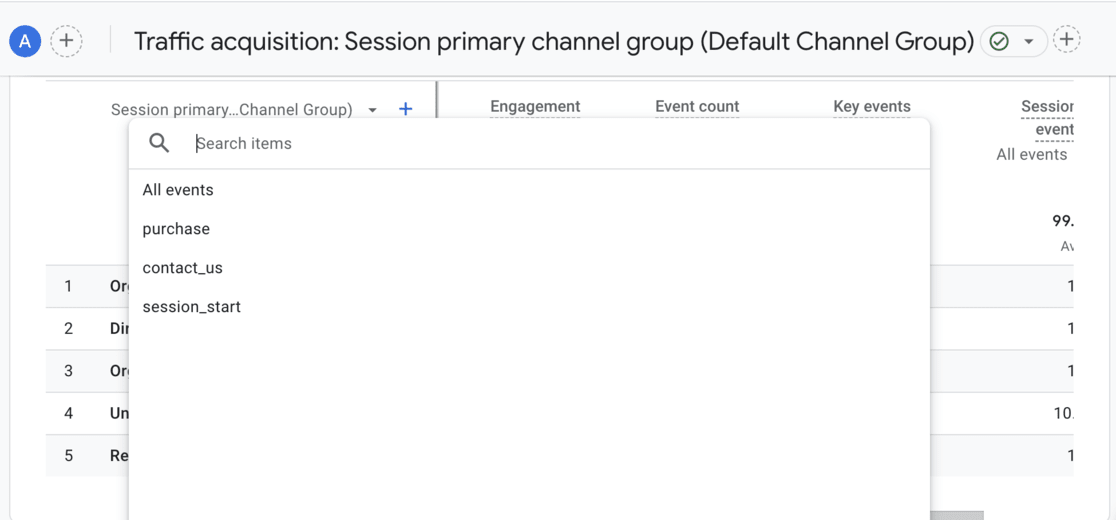
Now, the table will show total purchases and revenue by traffic channel.

How do users reach the checkout? Do they check out on their first visit via referral? Do they find you via organic search and then return via direct channel to make a purchase?
Find out in your Top Conversion Paths report.
Navigate to the Advertising tab, then Attribution » Conversion Paths.
If you’re using OptinMonster to build popups and other marketing campaigns, you can use the revenue attribution feature to see how much each campaign earns.
10. Customer Acquisition Cost (CAC)
Customer Acquisition Cost (CAC) is the amount of money a business spends to acquire a new customer. This includes money spent on marketing, sales, and any other efforts to attract customers.
Knowing your CAC helps you understand how much you need to spend to get a new customer. It’s essential to ensure you spend your marketing and sales budget wisely. If your CAC is too high compared to each customer’s revenue, your business could struggle to turn a profit.
To calculate CAC, you simply divide the total amount of money spent on acquiring customers by the number of new customers gained during a specific period. Here’s the simple formula:
Customer Acquisition Cost (CAC) = (Number of New Customers Acquired)/(Total Marketing and Sales Expenses)
For example, if you spent $1,000 on marketing and sales in a month and gained 100 new customers, your CAC would be $10.
This means it costs you $10 to acquire each new customer.
By keeping an eye on your CAC, you can make informed decisions about your marketing strategies and ensure your spending leads to profitable growth.
And that’s it!
We hope you liked our guide to the top eCommerce metrics to track for your online store in GA4. If you found it helpful, be sure also to check out:
- Best eCommerce Plugins for WordPress
- How to Set Up Google Analytics eCommerce Tracking (Simple Way)
- Simple Ways to Boost Your eCommerce Conversion Rate
Not using ExactMetrics yet? Get started today!
And don’t forget to follow us on X and Facebook for more helpful Google Analytics and WordPress tutorials.

![10 Top eCommerce Metrics to Track Now [GA4]](https://www.exactmetrics.com/wp-content/uploads/2024/09/ecommerce-metrics-and-kpis-1-625x300.png)
