Are you diving into the world of website analytics for the first time? Are you curious about what your site’s visitors are up to? Google Analytics 4 (GA4) holds the key to unlocking these insights. But, let’s be honest, wrapping your head around the GA4 dashboard can feel like solving a puzzle.
It’s common for beginners to find the dashboard overwhelming, leaving them wondering where to start. That’s why we will simplify things, breaking down the basics of how GA4 works in this guide. You’ll learn how to find your way to different reports and, more importantly, understand what all that data tells you.
Let’s dive right in!
Why Use Google Analytics?
Google Analytics is like a magnifying glass for your website. It’s a free tool by Google that helps you understand what’s happening on your site. Here’s why you should use it:
- Track performance: Easily see how your website is doing. Find out if people like what you’re offering and how they’re engaging with your site.
- Check your marketing: Monitor if your marketing efforts to spread the word about your site are paying off.
- Content and product ideas: Discover what visitors like so you know what kind of content or products to focus on and produce more of.
- Understand your audience: Break down your visitors by age, gender, where they live, the gadgets they use, and more. This helps you know your audience and tailor your efforts to align with them.
- Boost your conversion rate: Learn which pages on your website are doing great and which ones need a little help to get more people to do what you want, like signing up or buying something.
As you can see, there are many great benefits and reasons why you should use Google Analytics to monitor your site’s performance.
Next, let’s look into navigating GA4 dashboard reports, where we’ll break down everything you need to know to make the most out of this essential tool.
GA4 Dashboard Reports
Once you’ve created a Google Analytics account and connected it to your website, you’ll have different Google Analytics dashboards presenting you with various data and reports.
You’ll land on the home dashboard when you first open Google Analytics. This page gives you a quick glimpse of how your website is performing.
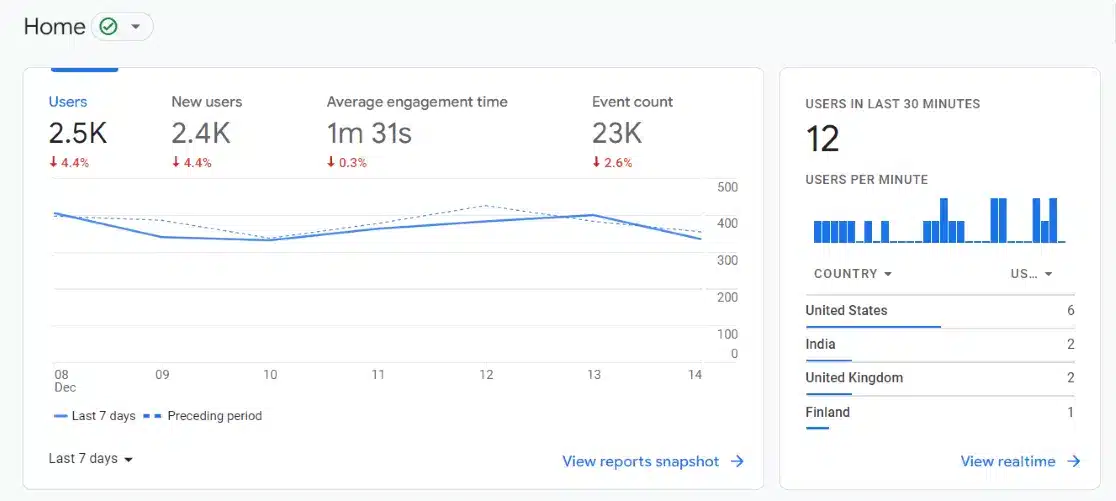
The GA4 home dashboard displays key metrics like:
- Users: The number of visitors to your site over the selected date range (e.g., last seven days)
- New Users: Out of the total users, how many hadn’t visited before
- Average Engagement Time: The average time spent on your site per visitor
- Event Count: The total number of events (clicks, form submissions, etc.)
On the left side, you’ll notice a navigation sidebar that expands when you hover over it. To access the various reports, click on the Reports tab:
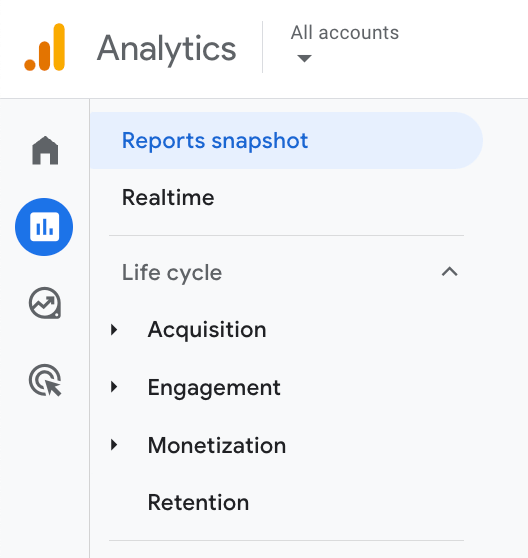
This will reveal a new navigation menu with the following report categories:
- Reports Snapshot
- Real-time
- Acquisition
- Engagement
- Monetization
- Retention
- Demographics
- Tech
Let’s explore what these reports cover and how you can use them.
Reports Snapshot
The Reports Snapshot acts as your quick-access overview within the GA4 dashboard, popping up when you select Reports from the left-side menu.
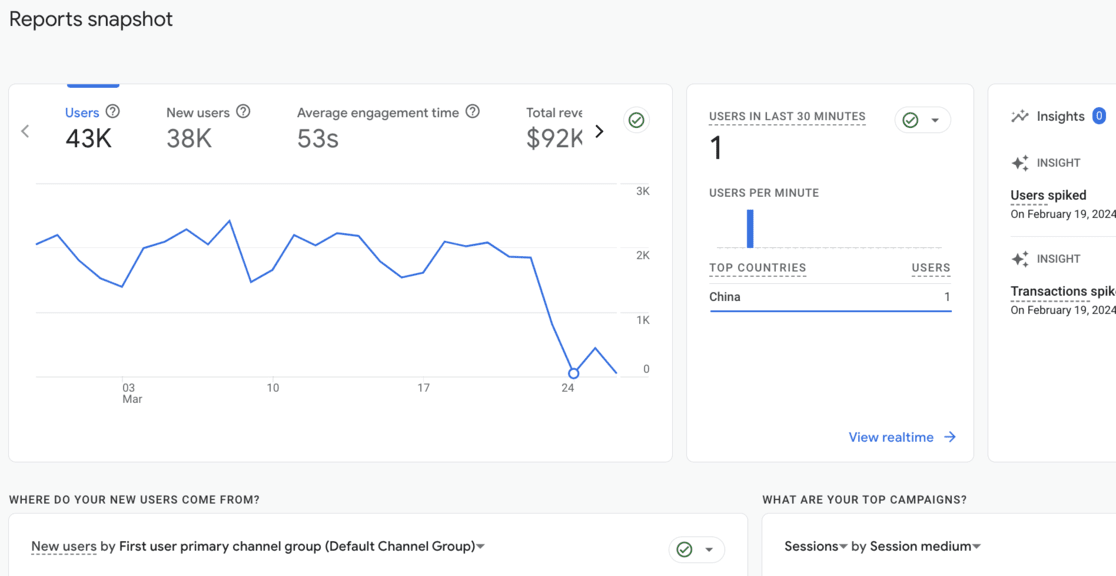
It’s customizable, allowing you to set any overview report of your choice as the snapshot.
Realtime
The Realtime Report in GA4 shows you your site’s current number of active users. It’s like a live window into who’s visiting right now.
The main card displays the user count from the last 30 minutes, broken down by device type (desktop, mobile, tablet).
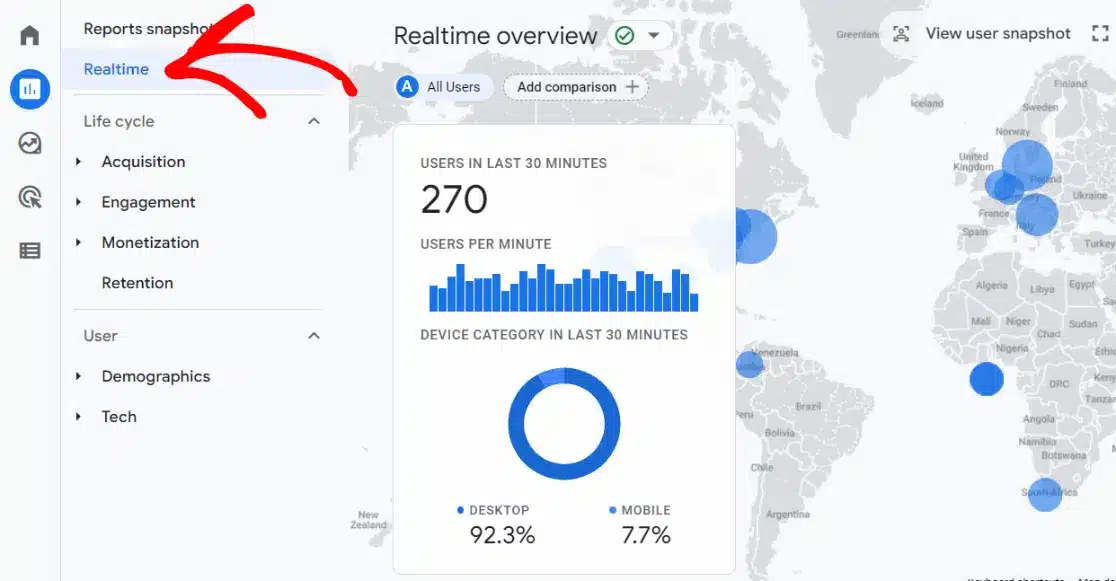
Scrolling down, you’ll find additional real-time cards with different insights.

This report is handy for monitoring the performance of recent campaigns, sales, giveaways, or social media promotions.
Acquisition
The Acquisition Report breaks down how visitors found your website.
To see the primary channels, start with the Traffic Acquisition report:
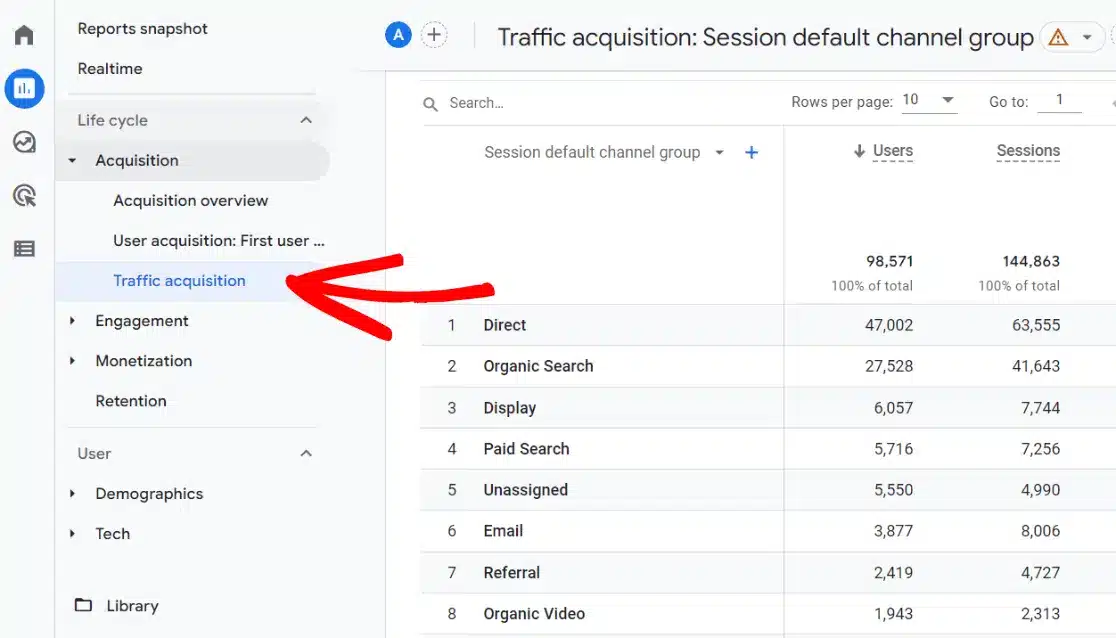
Here, your traffic will be categorized into channels like:
- Direct: People who typed your URL or used a bookmark
- Organic Search: Visitors from search engines (Google, Bing, etc.)
- Referral: Traffic from other websites linking to you
- Paid Search: Visitors from paid ads such as your Google Ads campaigns
- Organic Social: Non-ad traffic from social platforms
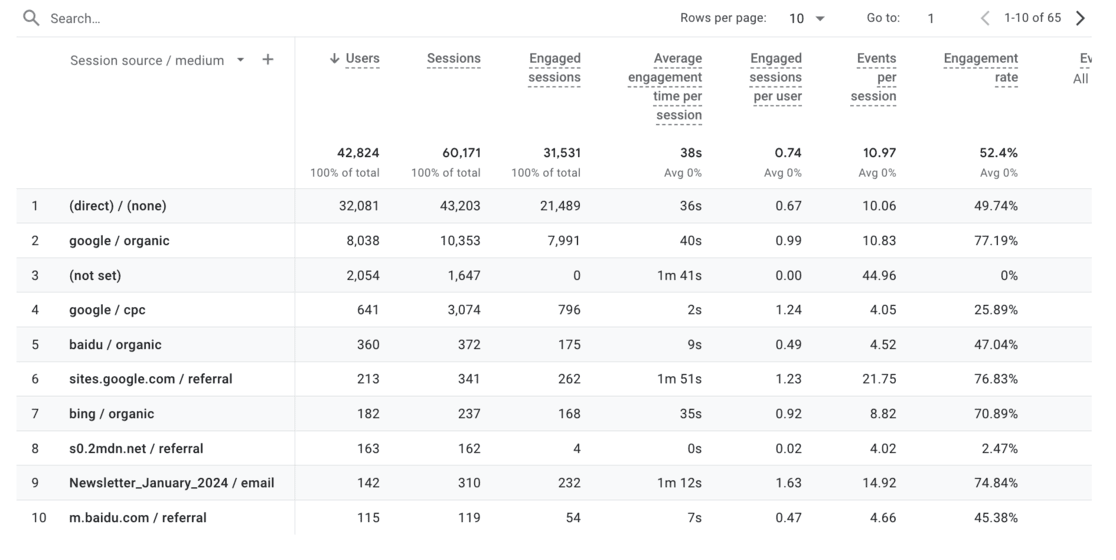
For more in-depth details, you can expand the Session default channel group dropdown and select Session source/medium to see the exact traffic sources.
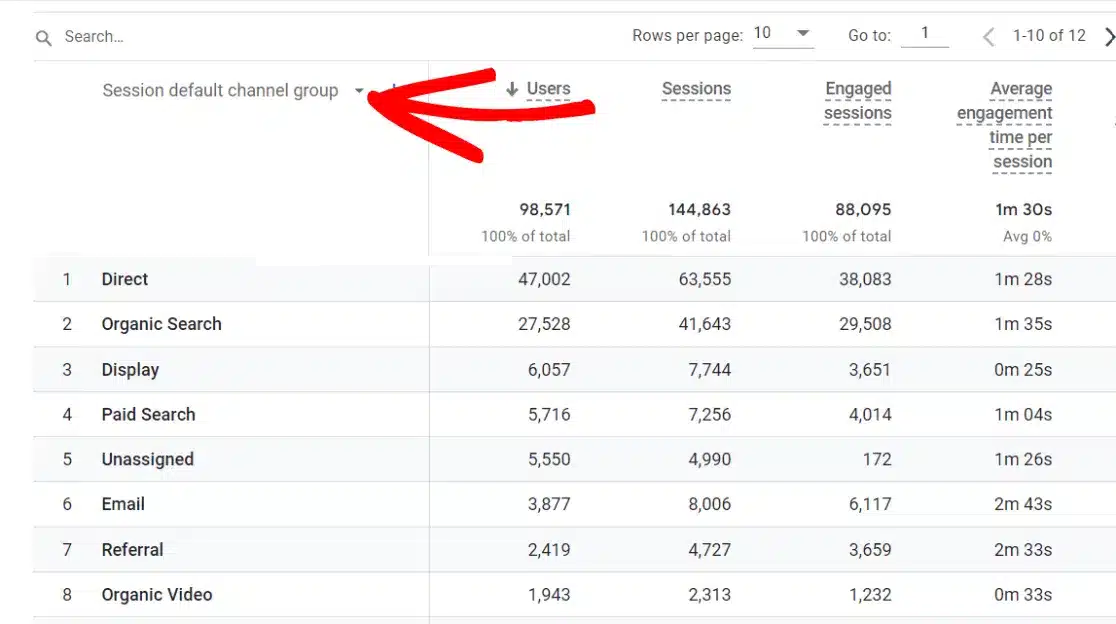
This data helps you identify which channels need more investment, like improving your SEO if organic search is lacking.
Engagement
The Engagement Report shows what users are doing on your site – the pages visited, events triggered, and conversions completed.
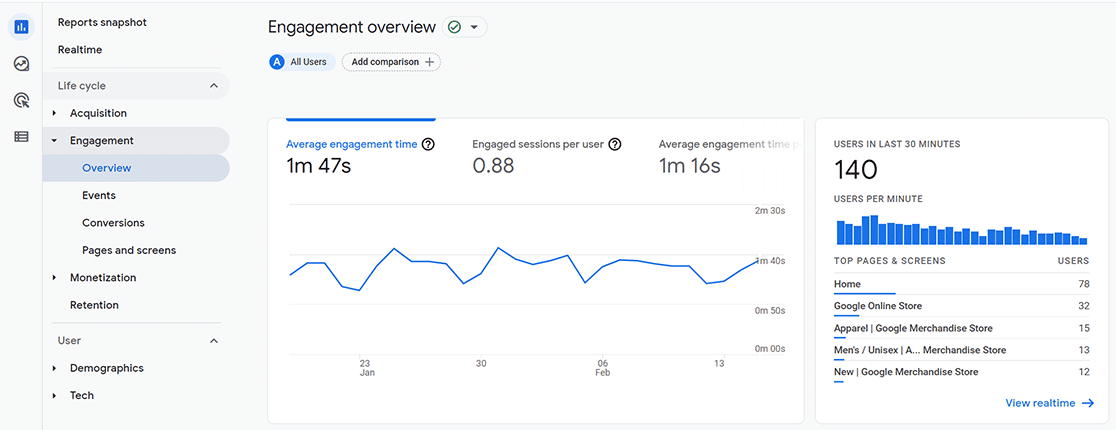
The Pages and Screens report is a great start:
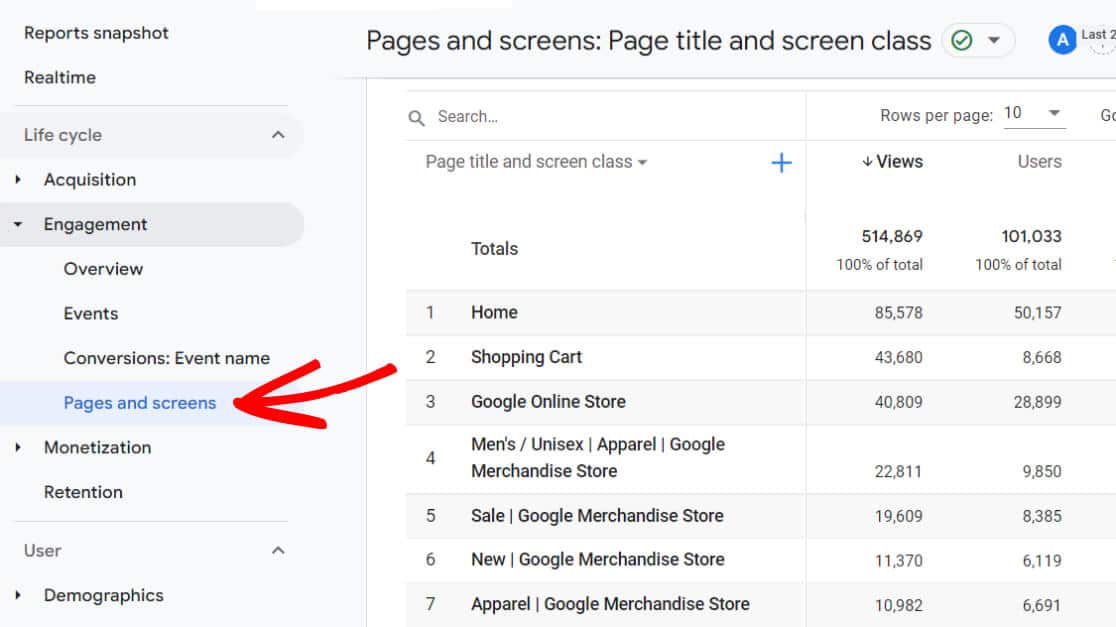
You’ll see metrics for each page, like views, users, average engagement time, events, conversions, and revenue.
This overview highlights your top-performing and underperforming pages.
There’s also a Landing Pages report with similar metrics focused on entry pages:
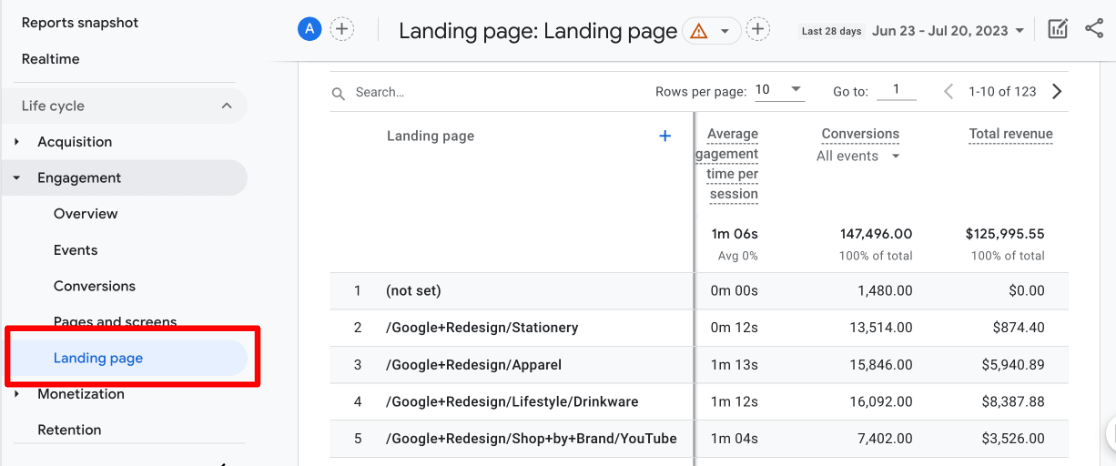
Use this data to see which landing pages drive the most traffic and engagement and which might be falling behind.
Monetization
The Monetization Report is for eCommerce sites selling products.
You’ll need to set up eCommerce tracking for your products in Google Analytics. With eCommerce tracking set up, you can view purchase metrics for each product.
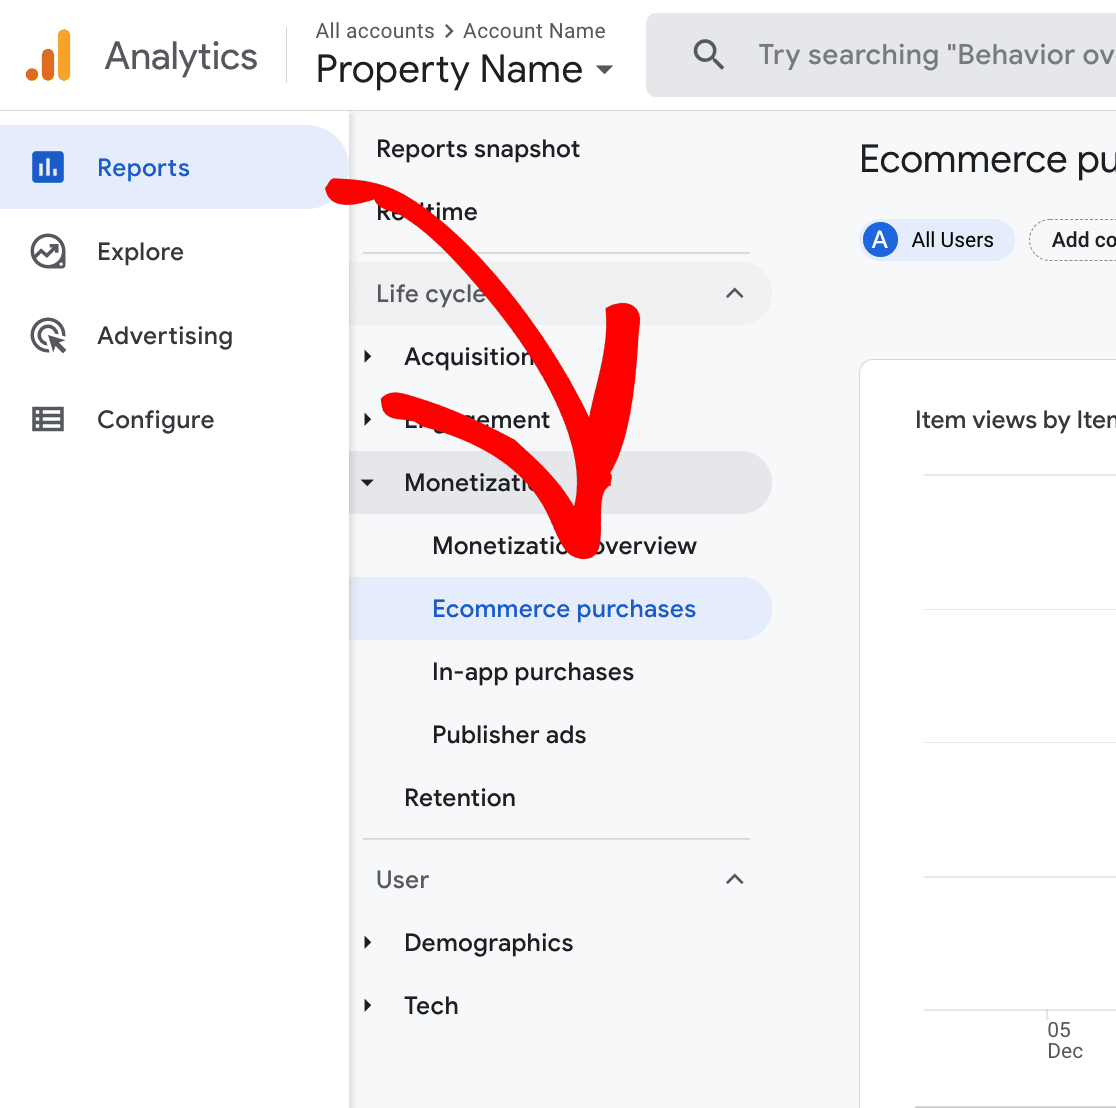
If you have a WordPress website, ExactMetrics automatically tracks your eCommerce site with a few easy clicks. If you don’t have a WordPress website, you must set up eCommerce tracking in GA4 using Google Tag Manager.
Retention
The Retention Overview Report offers a ready-to-use summary showing how effectively your website or app has users returning.
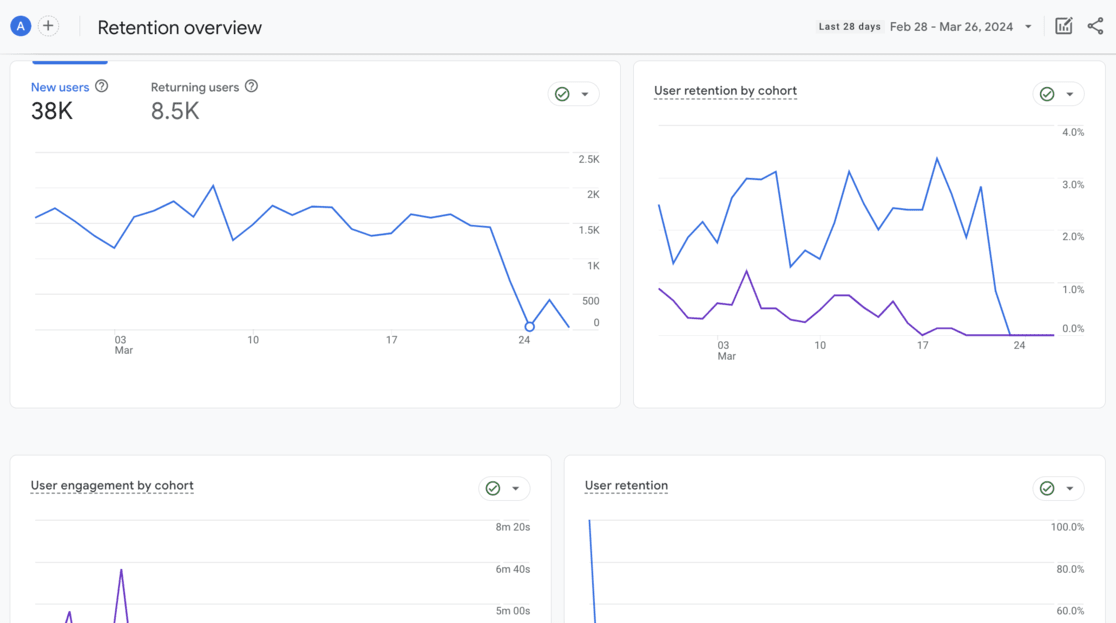
It includes key metrics like the average time users stay active on your site or app from their initial visit and the daily return rate of users within their first 42 days.
This data is an indicator of whether or not visitors return to your site for more of what you offer.
Demographics
The Demographics Report provides audience insights like location, age, gender, and language – helping you better understand and cater to your user base.
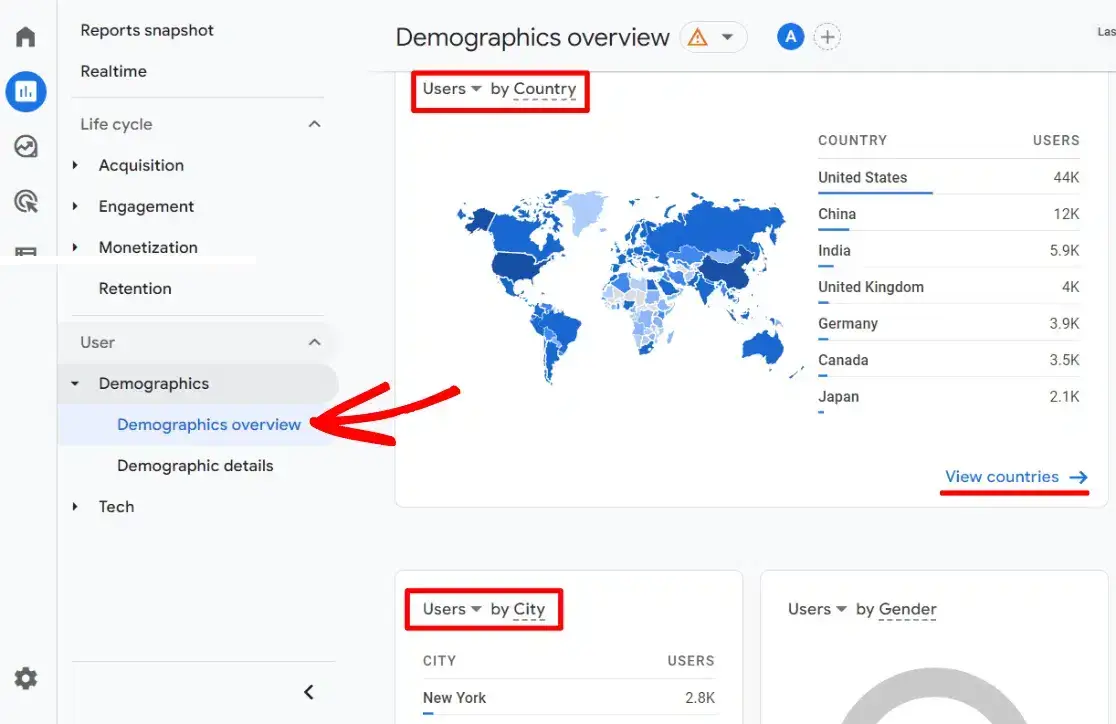
Knowing your audience is critical to creating content, products, and marketing strategies that resonate deeply with your visitors, ensuring your offerings align perfectly with what your users look for.
Tech
Finally, the Tech Report shows which devices, operating systems, and browsers your visitors use to access your site.
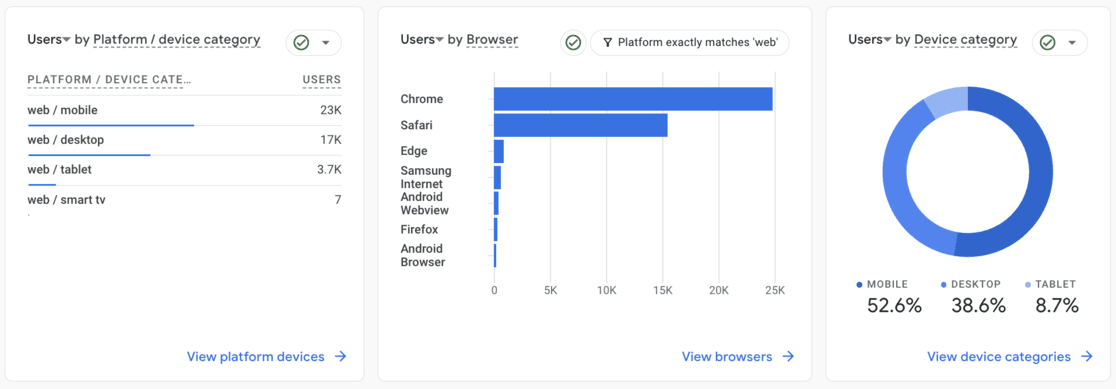
As you spend more time exploring these reports, you’ll get better at finding the most valuable data for your needs. Once comfortable with the basics, you can create custom exploration reports to create a dashboard in GA4 customized to your needs.
For WordPress website owners, let’s look at a much easier alternative to Google Analytics dashboards.
ExactMetrics: An Easier GA4 Dashboard Alternative
ExactMetrics is a highly intuitive Google Analytics plugin tailored for WordPress websites.
It empowers users of all skill levels, including beginners, to seamlessly install, configure, and leverage Google Analytics within WordPress without delving into any coding.
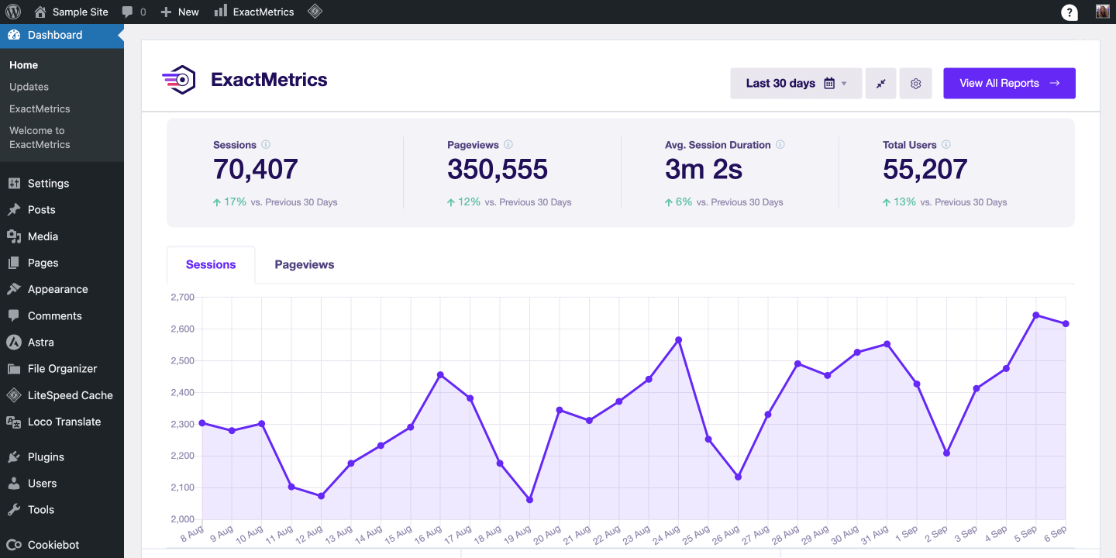
ExactMetrics offers a diverse range of reports that make understanding meaningful insights from Google Analytics data a breeze.
Let’s take a look at some of the different reports that are available.
Overview Report
The website overview report visually represents your site’s sessions and pageviews. You’ll find the total number of sessions, total page views, average session duration, and total users.
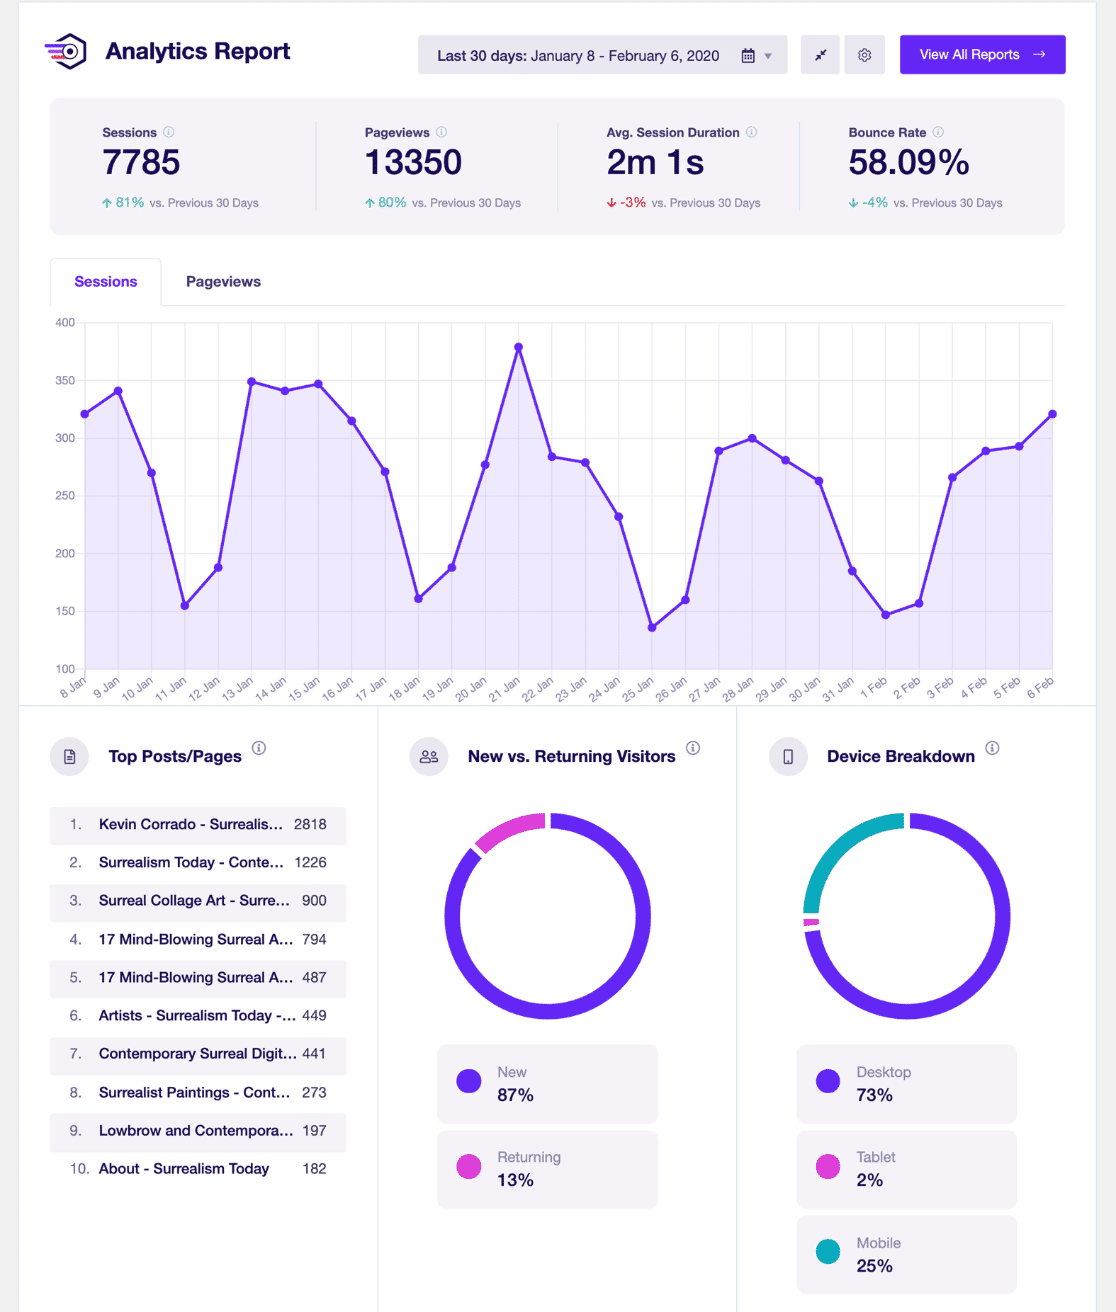
Below the top graph in the overview report, you’ll also uncover the following metrics:
- Breakdown of new versus returning users
- Device distribution (divided into desktop, tablet, and mobile users)
- Top 10 countries from which your visitors originate
- Top 10 referral websites driving traffic to your site
- Top-performing posts/pages
Traffic Report
The second section within ExactMetrics is the Traffic report.
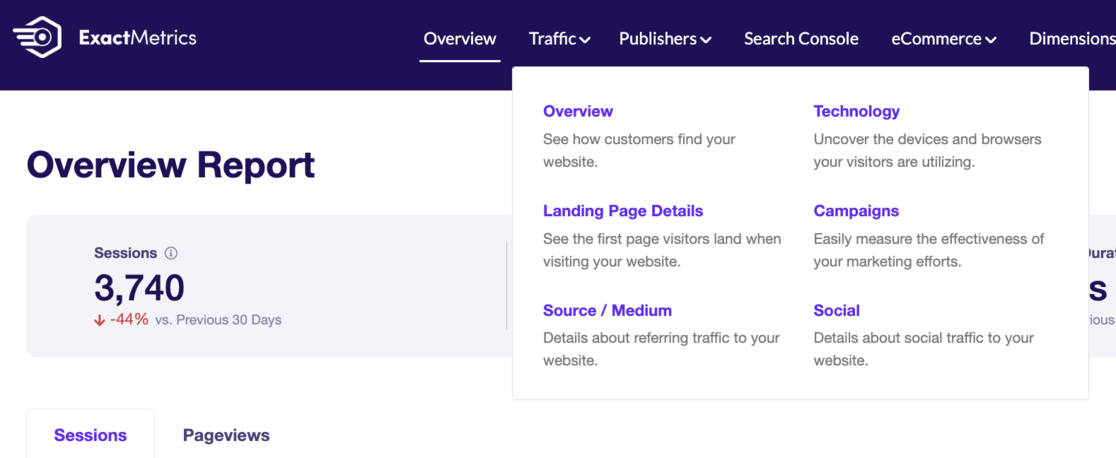
This section gives you access to distinct reports, providing crucial information about your traffic sources, devices, landing pages, campaigns, and more.
Publishers Report
The next report available is the Publishers Report.
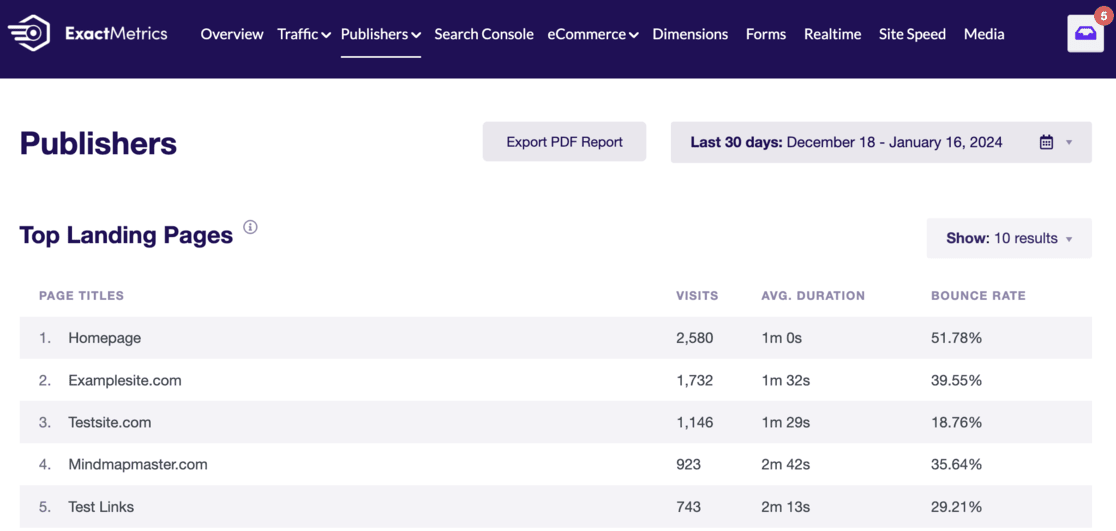
Here, you’ll find your top landing pages, outbound links, affiliate links, download links, demographic data, scroll depth analysis, and interest categories.
Use this invaluable data to create more of what your audience loves.
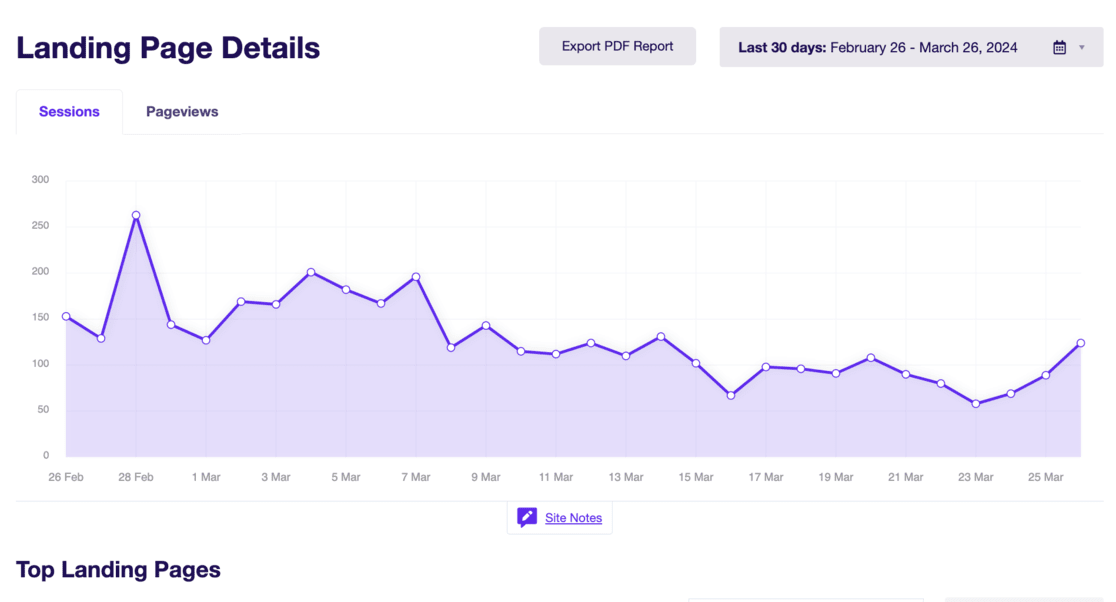
Top Landing Pages Report
Additionally, a dedicated pages report in this section offers more detailed insights into your most visited pages:
Search Console Report
The fourth report tab is the Search Console report, where you can view the top search queries that users employ to find your site through search engines.
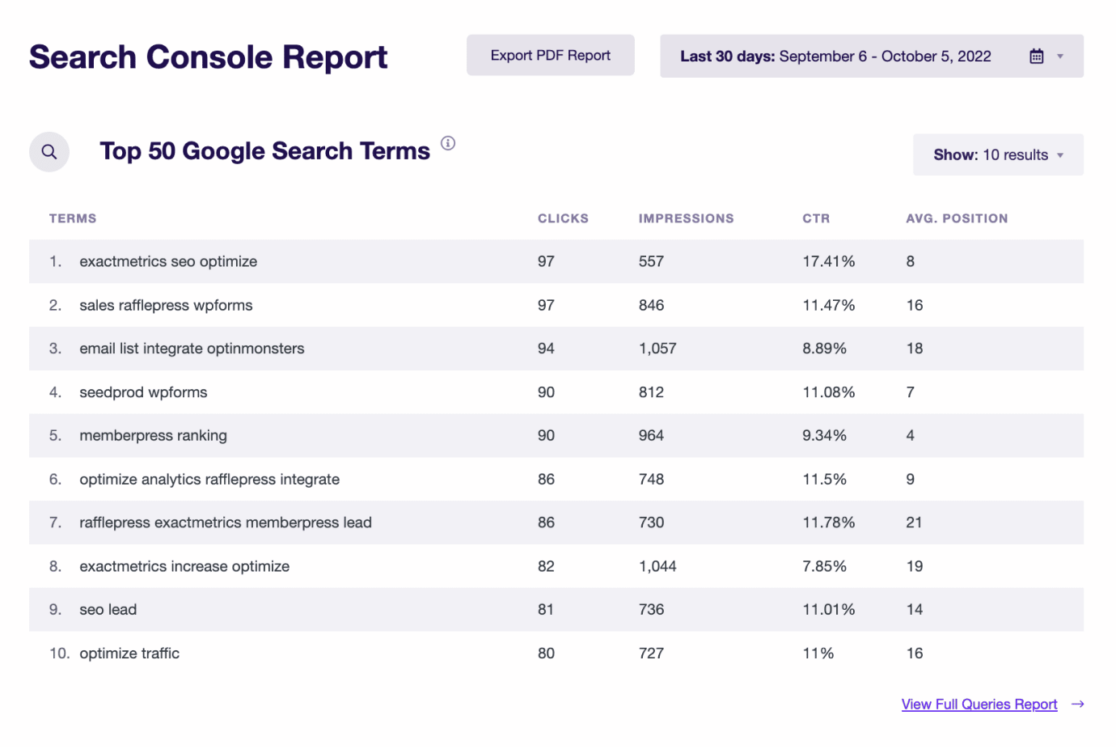
This data is great for accessing your top-ranking keywords and getting a good view of the SEO performance of your website.
eCommerce Report
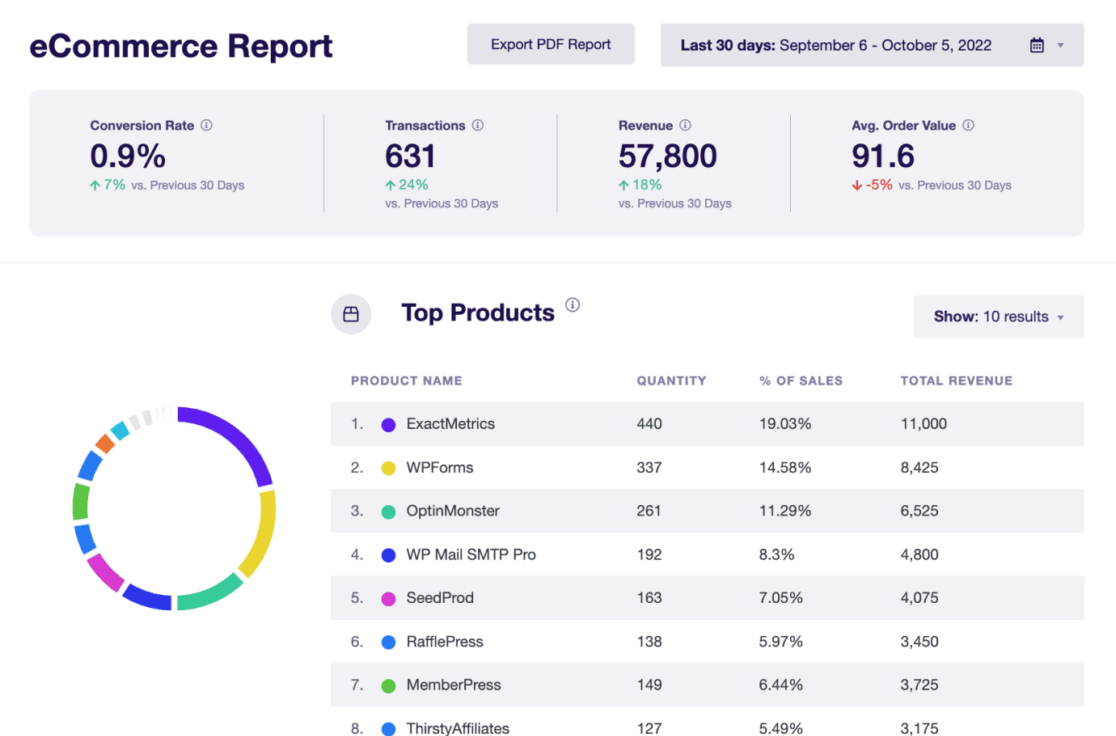
ExactMetrics also features an eCommerce report, providing a comprehensive overview of your online store’s performance. You can monitor your shop’s conversion rate, number of transactions, generated revenue, and average order value.
Moreover, you’ll have access to your top-selling products and numerous other helpful metrics about your online store.
User Journey Report
The User Journey report illustrates users’ steps when purchasing on your eCommerce website.
This report is not located in the top navigation within the ExactMetrics dashboard; you can access it by navigating to ExactMetrics » User Journey.

Custom Dimensions Report
The next report we want to highlight is the Custom Dimensions Report. This feature allows you to set up and track valuable data that Google Analytics doesn’t natively capture, including:
- The most popular authors on your site
- The keywords you’ve used on your site that are driving the most traffic
- Top categories and tags on your site
- Logged-in users
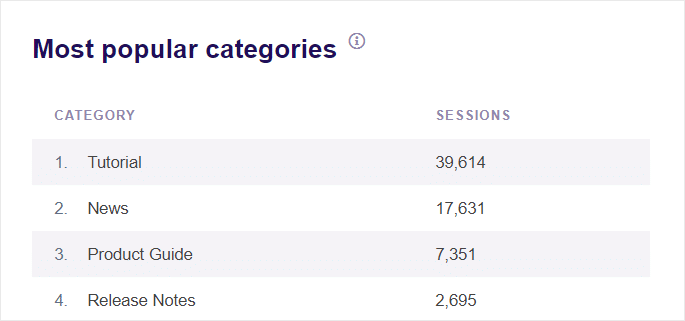
ExactMetrics lets you easily set up advanced tracking of various events with a few clicks. This task would be highly time-consuming and technical if you had to do this manually in Google Analytics.
Forms Report
Next in ExactMetrics is the Forms Report.
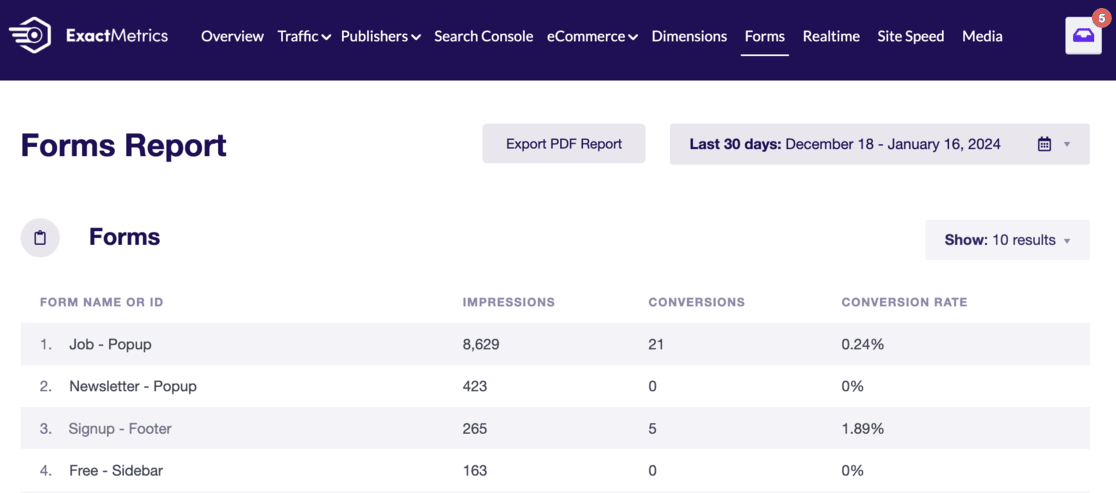
It automatically tracks all the forms on your site without any additional setup (beyond installing our addon) and provides data on their conversion rates and submissions.
Real-time Report
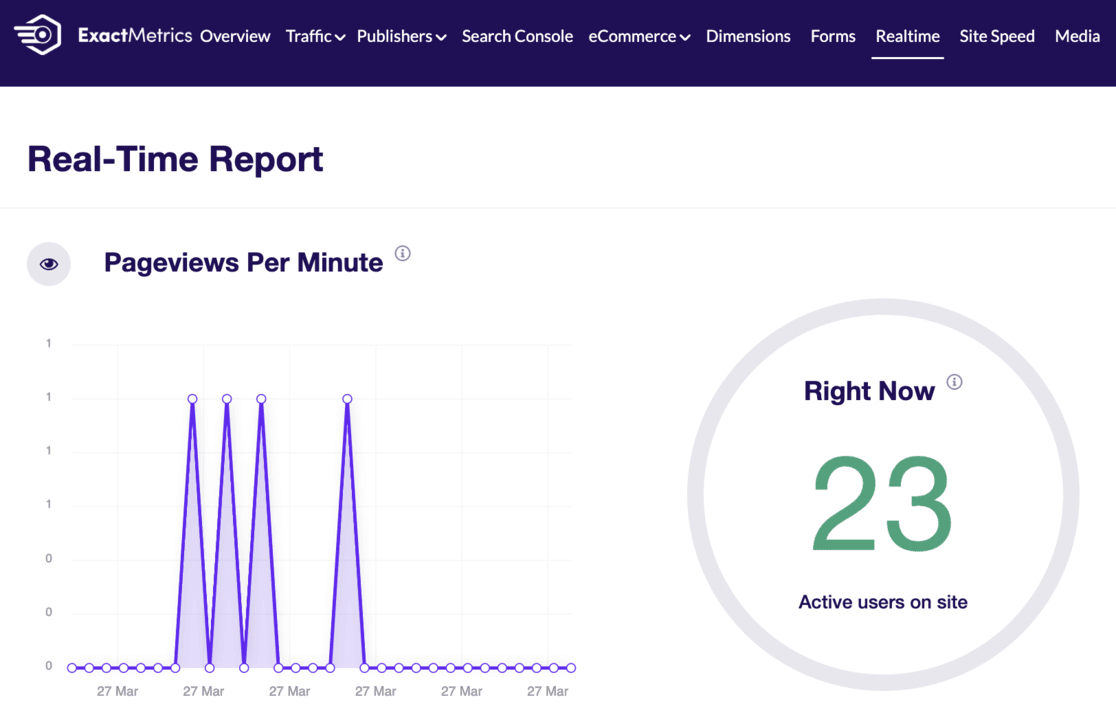
Do you like real-time traffic monitoring after sending emails or social media campaigns? Open the ExactMetrics Real-time report to see how many people are on your site, what pages they view, and their locations.
Site Speed Report
The speed of your website can significantly impact various factors, including your search engine rankings and organic traffic.
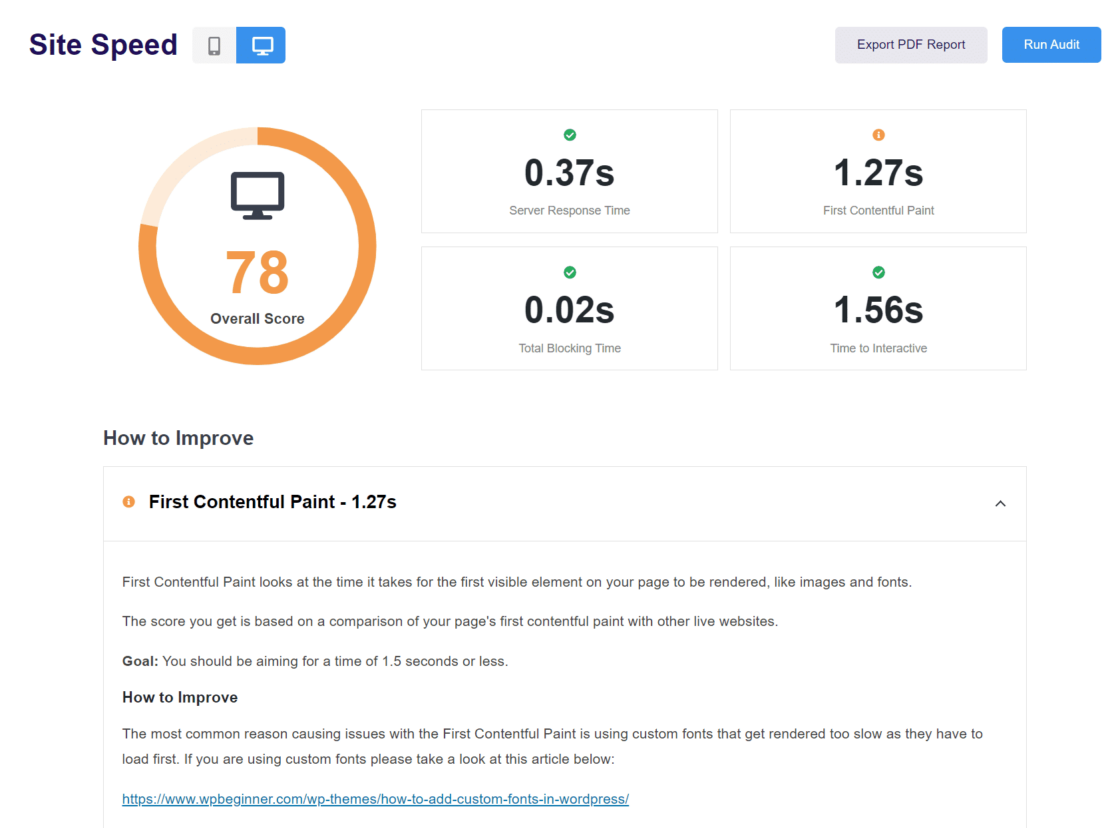
Therefore, you can access your up-to-the-minute site speed report within ExactMetrics anytime.
Media
If videos are embedded on your website, you can track their view counts using the ExactMetrics media report.
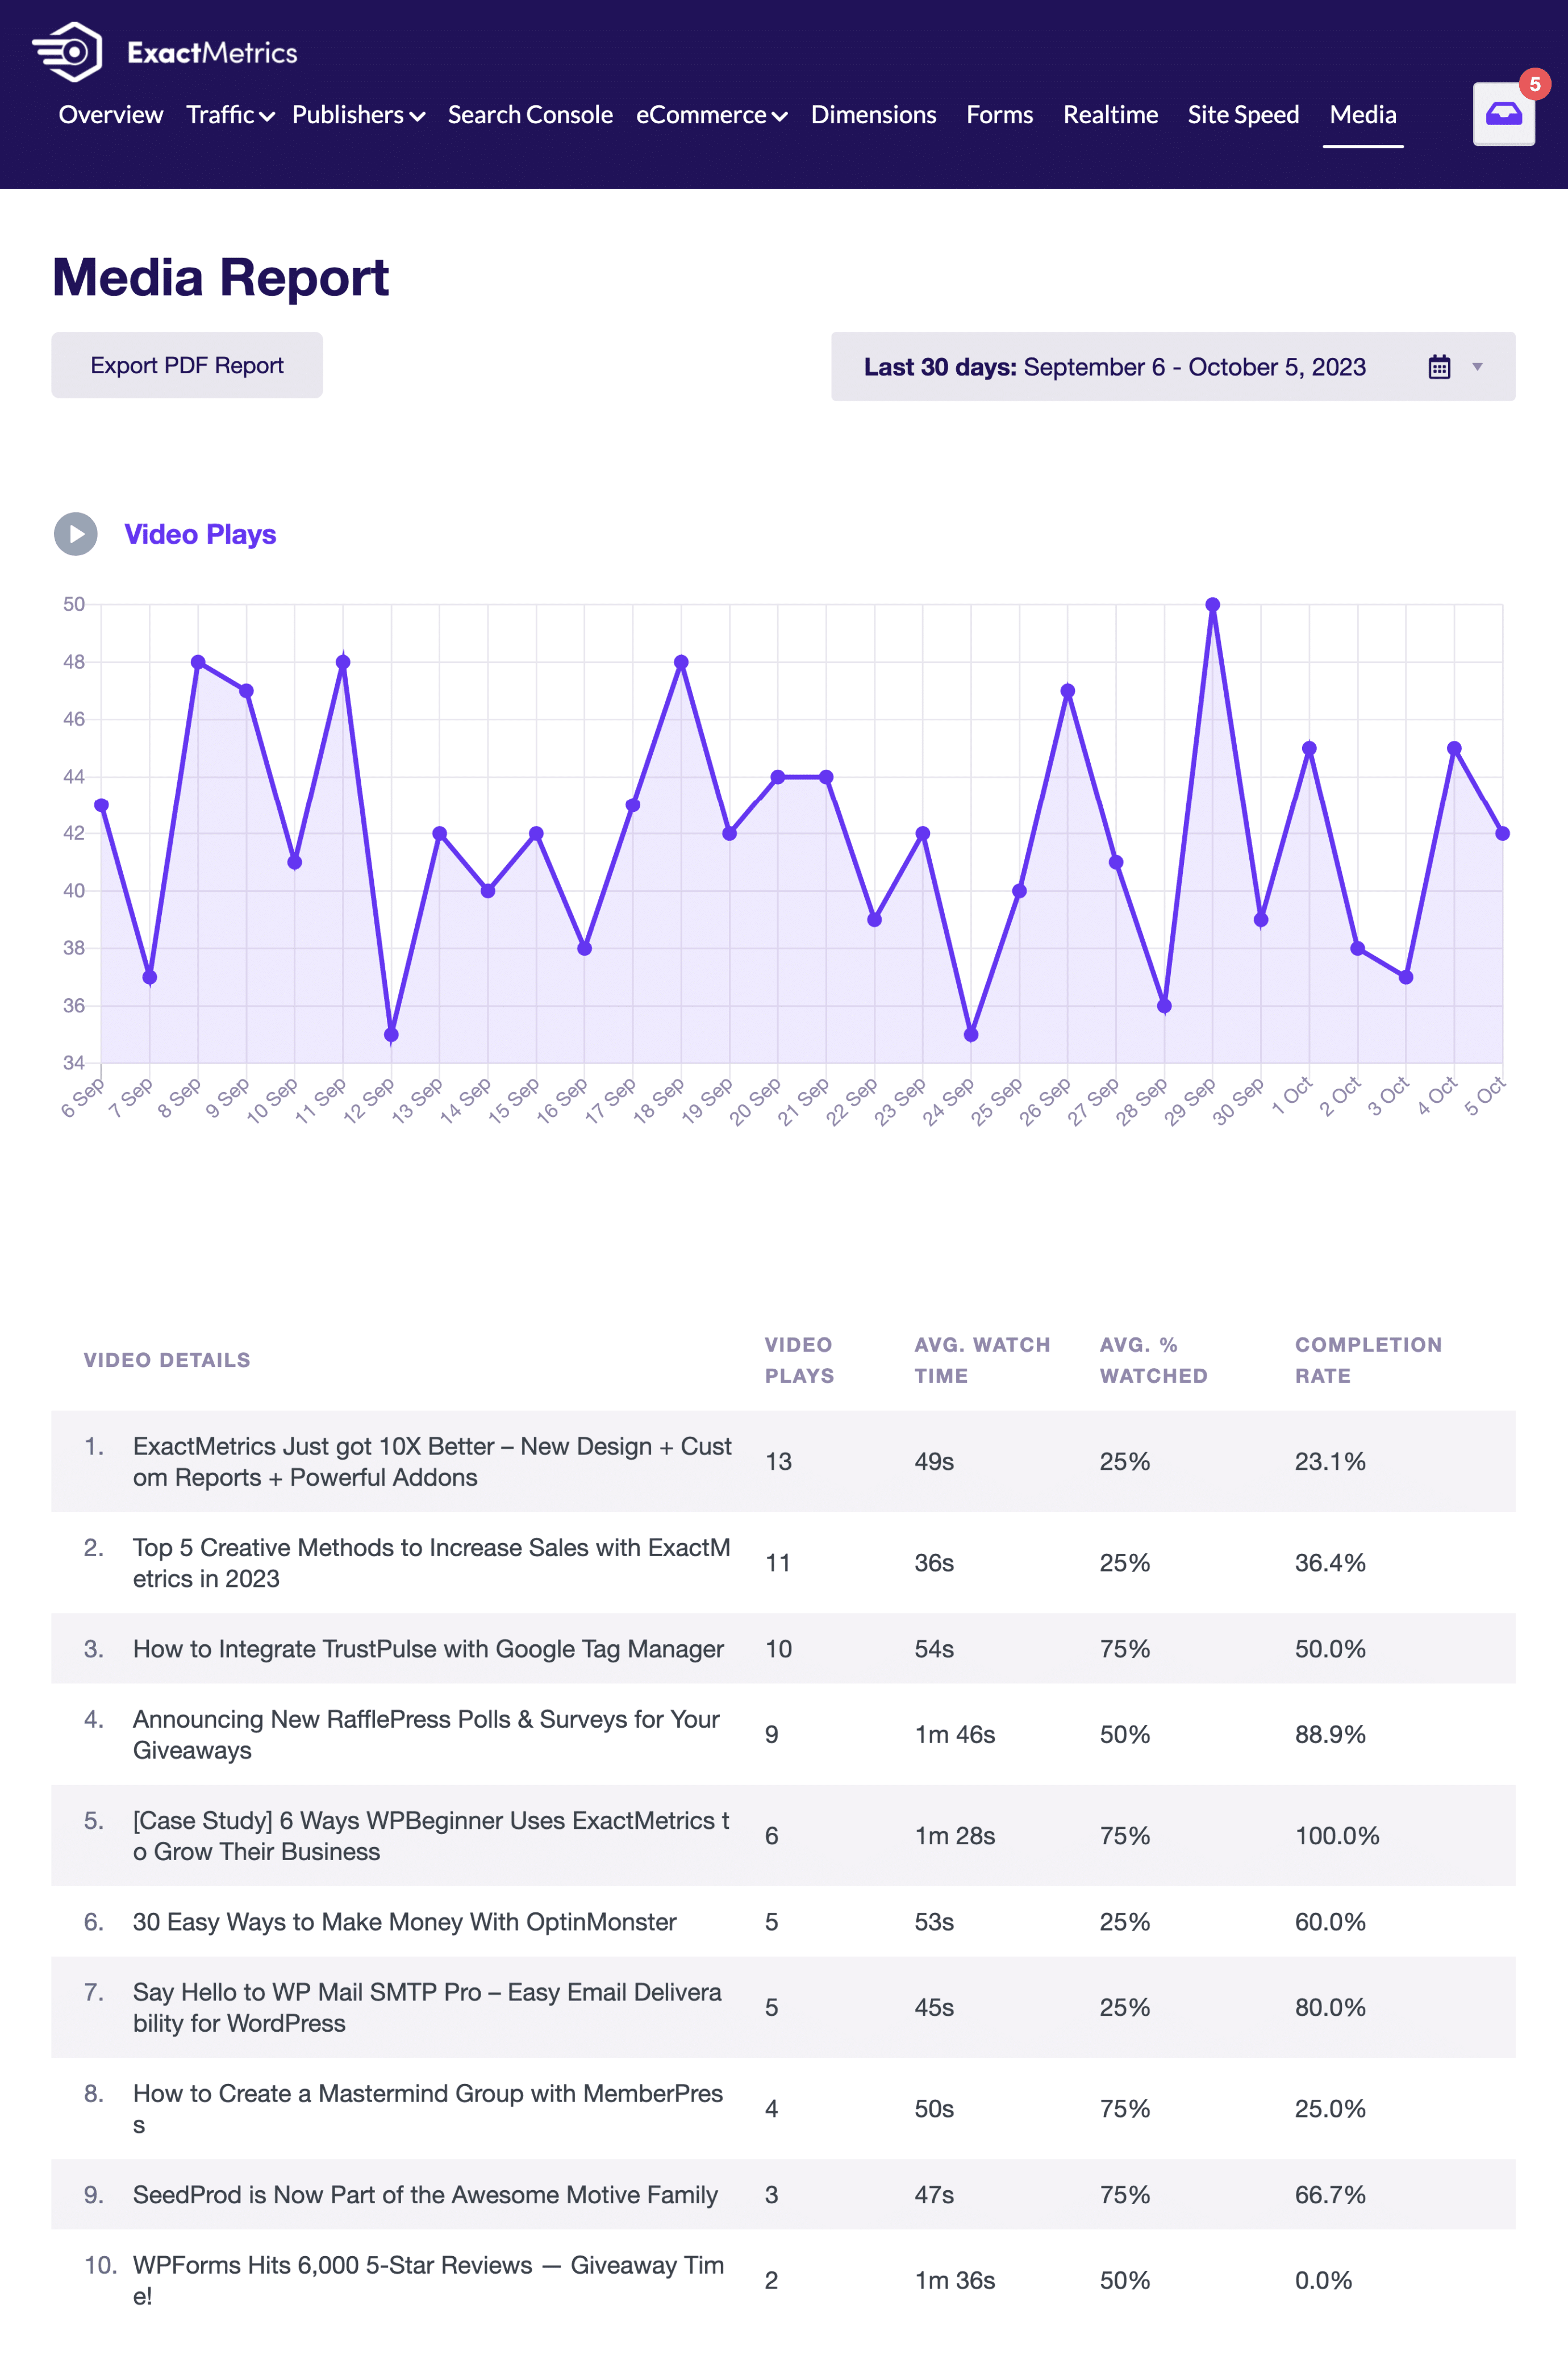
This report allows you to monitor your videos and make changes to ensure they perform at their best.
And that’s it!
With just a few simple clicks, you get these comprehensive reports directly from Google Analytics right within your WordPress dashboard.
Setting up ExactMetrics on your WordPress site is a breeze, thanks to its user-friendly setup wizard.
Moreover, this robust tool simplifies Google Analytics by offering an intuitive dashboard and options to tailor how your data is presented, making your analytics journey smooth and efficient.
Get started with ExactMetrics today!
We hope you liked this tutorial on the GA4 dashboard reports. Make sure to check out:
- 8 Types of Google Analytics Reports to Track (The Best Ones)
- How to Create Google Analytics 4 Custom Exploration Reports
- How to Share Your Google Analytics Reports (3 Easy Ways)
Remember to follow us on X and Facebook for more helpful Google Analytics tips.

