Can’t find your bounce rate in Google Analytics 4? Wondering how to track user engagement on your pages without bounce rate as a metric? Luckily, you can still access the Google Analytics bounce rate metric, but you can also use other GA4 metrics that are great for tracking user engagement.
In this guide, we’ll explain why bounce rate is no longer a default metric in GA4, how you can still access it inside your Google Analytics property, and better engagement metrics to watch instead of bounce rate. And if you’re a WordPress user, we’ll show you how you can access your bounce rate metric inside your dashboard.
Why Google Analytics 4 Doesn’t Show Bounce Rate
Historically, many marketers used bounce rate as a way to measure how engaging a web page was for visitors. A high bounce rate indicated that too many people landed on the page but didn’t click anything else or view other pages before leaving.
However, bounce rate had some pretty big flaws. Using the old calculation, even users who spent a long time engaging with your content could be counted as a “bounce” if they didn’t visit any other pages.
To provide more meaningful engagement data, Google Analytics 4 has shifted away from bounce rate as a primary metric. Instead, it focuses on engagement metrics that give a clearer picture of how users interact with your content and website.
Bounce Rate and Engagement Metrics in GA4
In previous versions of Google Analytics, bounce rate was calculated as:
Bounce rate = Total single-page sessions / Total entrances on that page
A “bounce” was any session where the user left after viewing just one page. But even if someone spent 10 minutes reading an in-depth article, that could still count as a bounce. That turned bounce rate into a metric that was higher than it should have been! A visitor could have clicked on your site from search results and spent 5 minutes reading all of the content on your page, but still counted as a bounce because they didn’t complete any actions (like filling out a form or clicking a call-to-action).
In GA4, Google tried to fix that by introducing new engagement metrics like the following to give you better insight into what users actually did during their visit:
- Engaged Sessions – Sessions that included an event trigger (like a click or signup), multiple pageviews, or lasted over 10 seconds
- Engagement Rate – Percentage of sessions considered “engaged” based on the criteria above
- Avg. Engagement Time – How long users spent engaged with your content during their visit
- Engagement Time per Page – Average time users were engaged with a page
These engagement metrics let you distinguish between meaningless bounces and sessions where users were highly engaged with your content, even if just on a single page.
How to View Bounce Rate in Google Analytics 4
Though it is no longer a default metric, bounce rate can still be added to GA4 reports if you want to keep track of it. Just keep in mind the criteria have changed – any session over 10 seconds is no longer counted as a bounce, even if the visitor didn’t do anything but stay on the page for more than 10 seconds.
Note: You can change your site’s settings for how long it takes for a session to count as engaged. To do that, follow Google’s tutorial.
Add Bounce Rate to the Pages and Screens Report
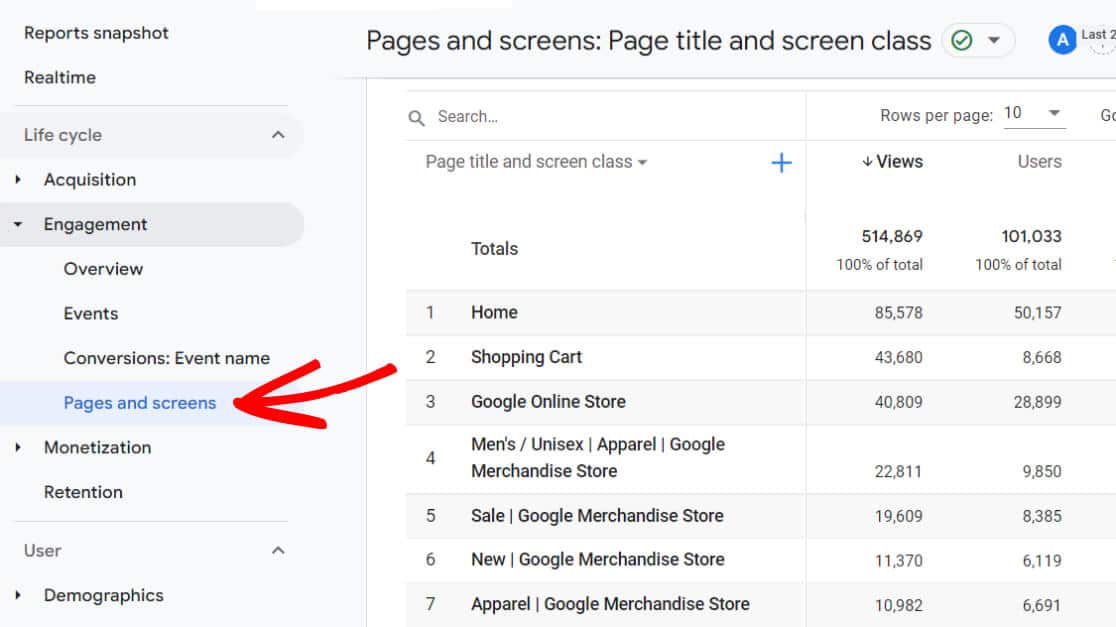
Step 1: In Google Analytics, navigate to Engagement » Pages and screens:
Step 2: Click the pencil icon in the upper right to edit the report:

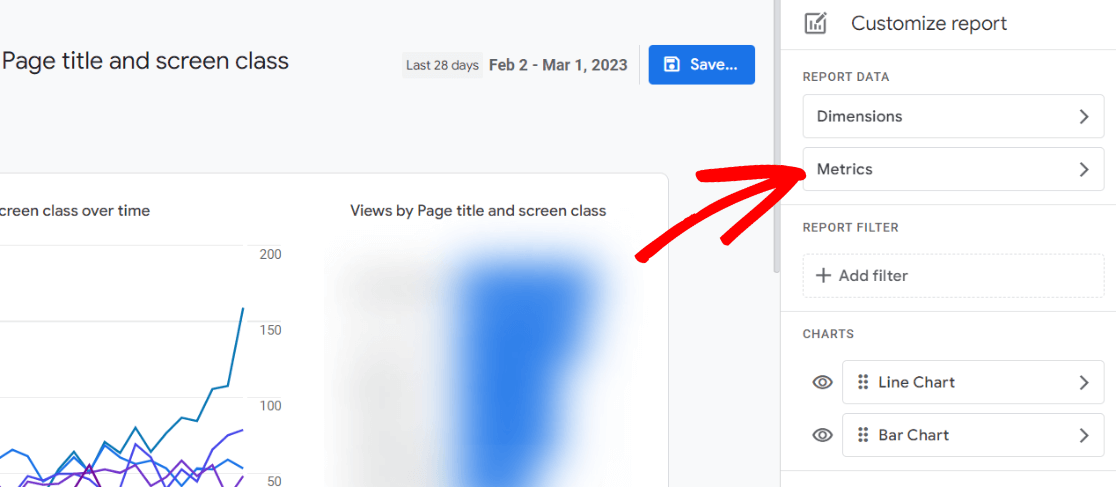
Step 3: Click on the Metrics button:
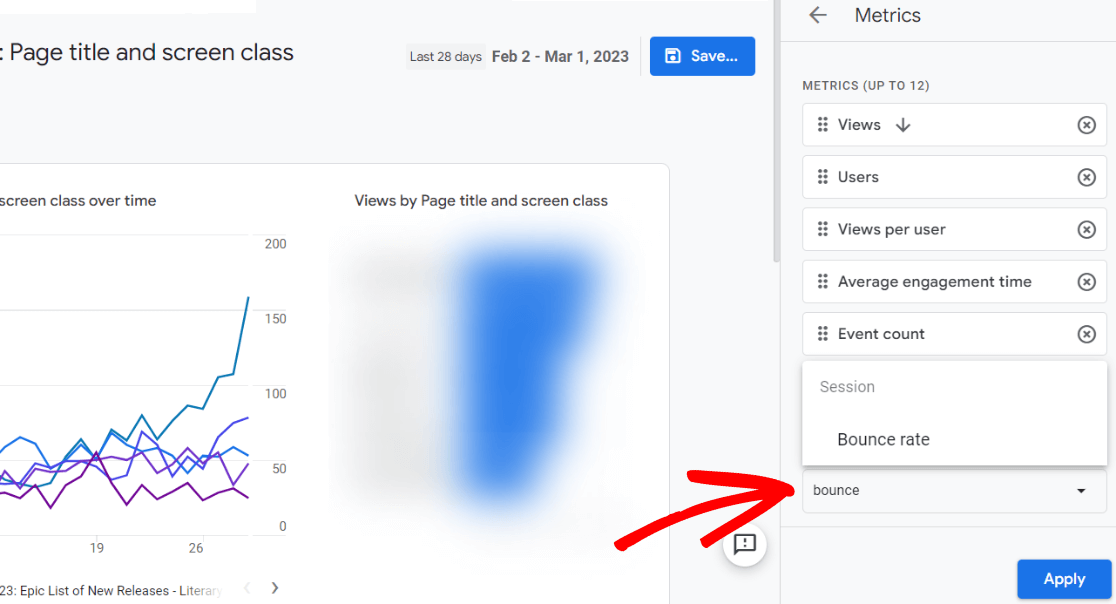
Step 4: Search for Bounce rate and click on it:
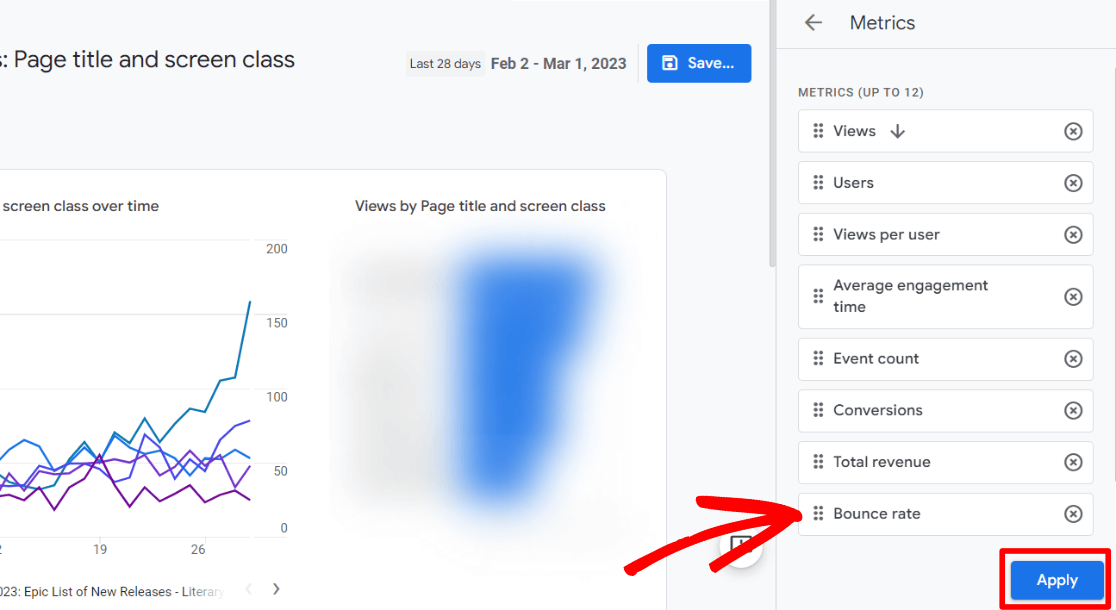
Step 4: Once you have Bounce rate selected, you can click and drag it to wherever you want it to appear in your report. Then, click Apply.
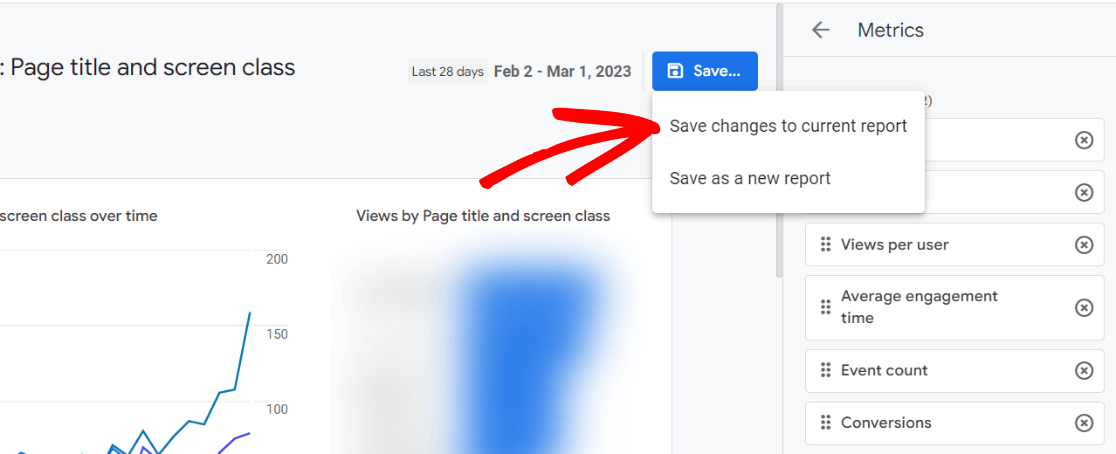
Step 5: Click on Save, then Save changes to current report:
Step 6: Finally, a popup will appear asking if you’re sure you want to modify your report. Go ahead and click Save:
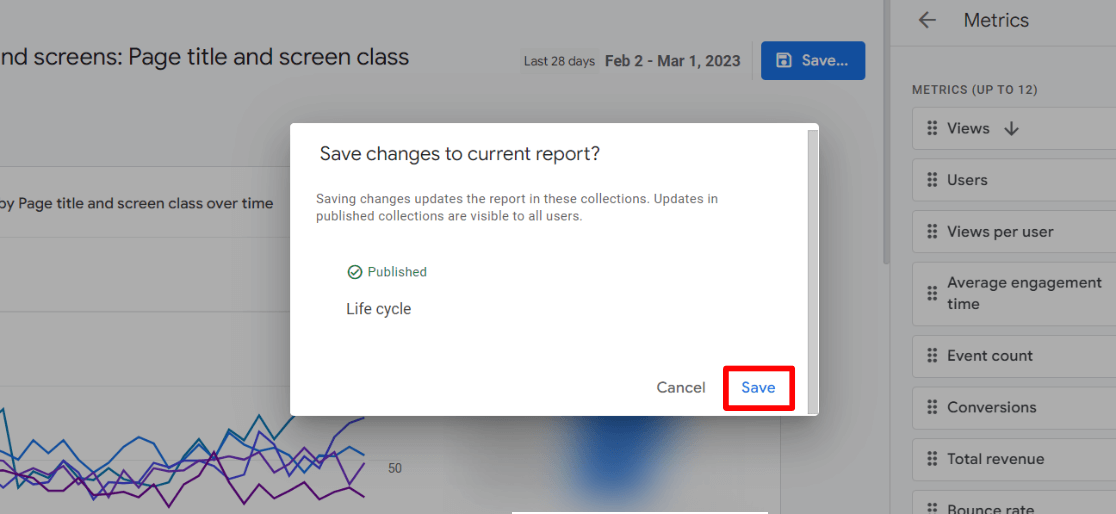
Then click the Back arrow to exit:

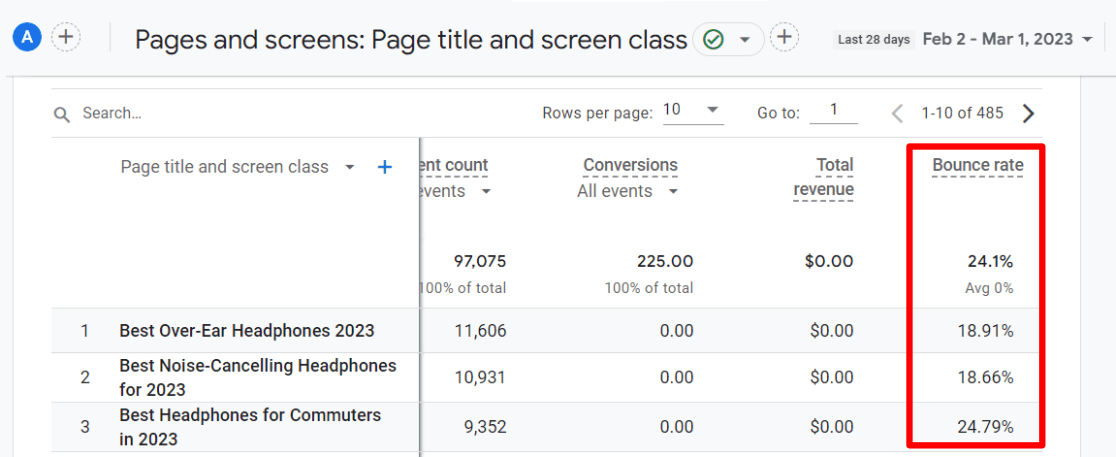
That’s it! The bounce rate column will now be visible, showing the bounce rate percentage for each page/screen.
How to See Bounce Rate in WordPress
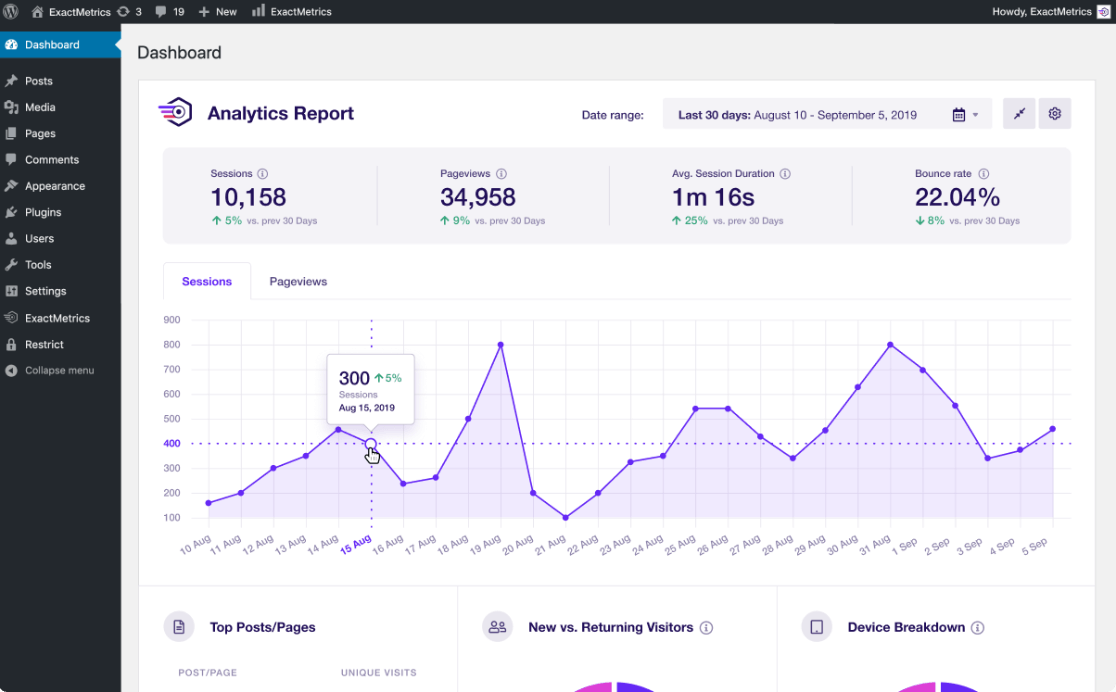
For WordPress users, the ExactMetrics plugin makes it easy to view your site’s bounce rate from your WordPress dashboard.
ExactMetrics is the best premium WordPress analytics plugin. With ExactMetrics, you can set up and monitor many different metrics and tracking features in Google Analytics and your WordPress dashboard.
Our most popular features include:
- Easy eCommerce tracking setup
- Top outbound and top affiliate link clicks
- GDPR compliance
- Scroll tracking
- Form submissions tracking
- Popular posts or products widget
- Site notes (annotations)
- Campaigns report
With ExactMetrics, all your most important metrics are right there in your WordPress dashboard. Simply install and activate ExactMetrics, then view all your important metrics like bounce rate without leaving WordPress.
For a full tutorial on setting up ExactMetrics, check out How to Add Google Analytics to WordPress (Step-by-Step Guide).
With ExactMetrics, you’ll find bounce rate included in several reports:
– Social media traffic report
– Top landing pages report
– Publisher reports
– And more!
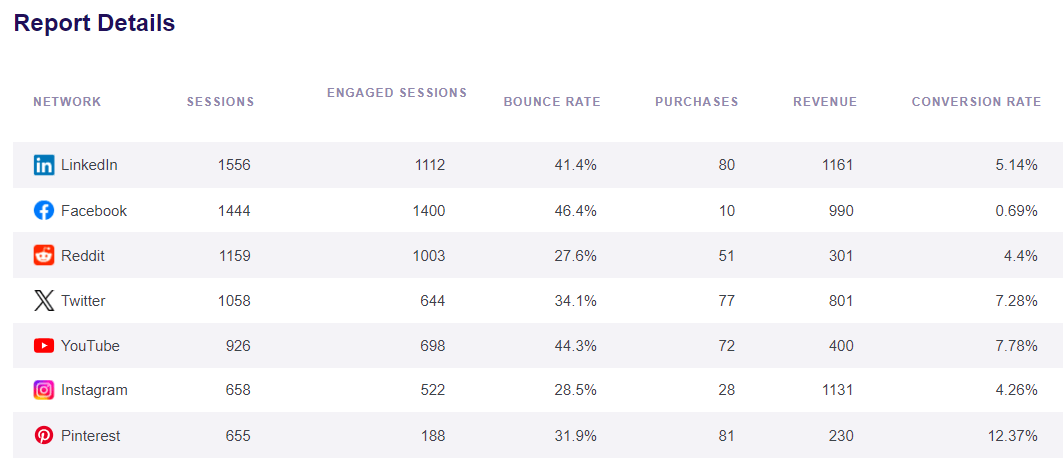
For example, in the social media report (available in ExactMetrics Plus and up), you’ll see your bounce rate for each of the different social media channels that sent traffic to your site:
Get ExactMetrics today for comprehensive Google Analytics reporting in WordPress, including the bounce rate metric.
That’s it!
We hope you found our Google Analytics bounce rate tutorial helpful. If you liked this tutorial, you might also want to check out:
Google Analytics Funnel Reports: How-to-Guide
How to Track Outbound Links in Google Analytics (GA4 Guide)
2 Key Google Analytics Metrics Every Business Should Track
How to Use Google Analytics for SEO (10 Proven Ways)
Not an ExactMetrics user yet? Get started with the top Google Analytics plugin for WordPress sites now!
Don’t forget to follow us on Twitter and Facebook to see all the latest Google Analytics tutorials.

